
Building Metrics with TimescaleDB
Darwin Wu· 11/29/2023 · 13 min read
Understanding how your system works is key to keeping one’s sanity.
As we have more users deploying their workloads on Inngest, a common set of questions start coming up more and more over time.
- Have my functions started?
- Are they delayed?
- If not,
- Why are they not starting?
- Is something stuck?
- Am I getting throttled?
- Was there a misconfiguration?
Not being able to tell what’s going on was a common complaint/feedback, and on the flip side, our team was spending more time diving into our data stores to see what’s going on in order to provide the answers our users are asking.
We completely understand the need to answer these basic questions in order for users to be successful, but for a team of less than 10, this eats up our capacity really fast. So it was pretty obvious to us that we needed to do something about it very quickly.
Understanding what to build
A lot of the questions falls into 2 buckets,
- Status - What’s going on?
- Resolution - What do I need to do to get out of this?
It’s almost impossible to provide a solution if you don’t know what the current status is, and to properly assess an issue, we need to understand the what and the why.
The metrics project was a focus to expose the What of the user’s workload as a starting point. The Why is usually trickier to address as there are always some kind of context behind it.
For example, a function with a concurrency setting could be throttled because
- There was a burst of events, and it exceed the limit
- External API that it was calling was having an outage, and all function runs has been failing, causing a lot of retries, and resulted in using up the limit
We can go on and on, and it’s impossible for us as service providers to tell users why something went wrong. It’s up to the users to know, but we can still provide the indicators to help them form a theory and get to the root cause.
Choosing the storage
Choosing the right tool for the job is always important. We’ve looked into a couple of existing tools,
We pretty much crossed off Prometheus related tools right off the bat. It’s generally a pain to maintain, and also scaling profile is questionable. You need a Thanos or some other tool like M3 or Mimir to use as a storage backend, or it’ll overflow very quickly.
InfluxDB was off the list mainly because it doesn’t have a local development solution. While cloud development has become more of a thing lately, it’s quite unreasonable to force the rest of the team to have to connect to some remote environment just to do development.
On top of that, having to think about keeping data separated, and not stepping on each other’s toes is a waste of brain capacity. A problem that won’t exist if you’re all running tools in a local environment.
It was now down to Timescale and Clickhouse. Due to prior jobs, I’d had a pretty pleasant experience as a user with Clickhouse, but maintaining it was the opposite experience. Cloudflare has a whole team behind it, to make sure topology and quorum are not obstructed. When they do, you can kiss your day goodbye (they’ve gotten a lot better at managing/automating it by the time I left).
While there was a managed solution with Clickhouse now, we ultimately decided to go with TimescaleDB for the following reasons:
- It is Postgres, and we do not need additional SQL drivers
- We already run Postgres so we have a good idea of the scaling profile and what pitfalls there are
- We already have some existing feature using TimescaleDB, and it was easier to expand the usage, instead of introducing a new database
Requirements & Approach
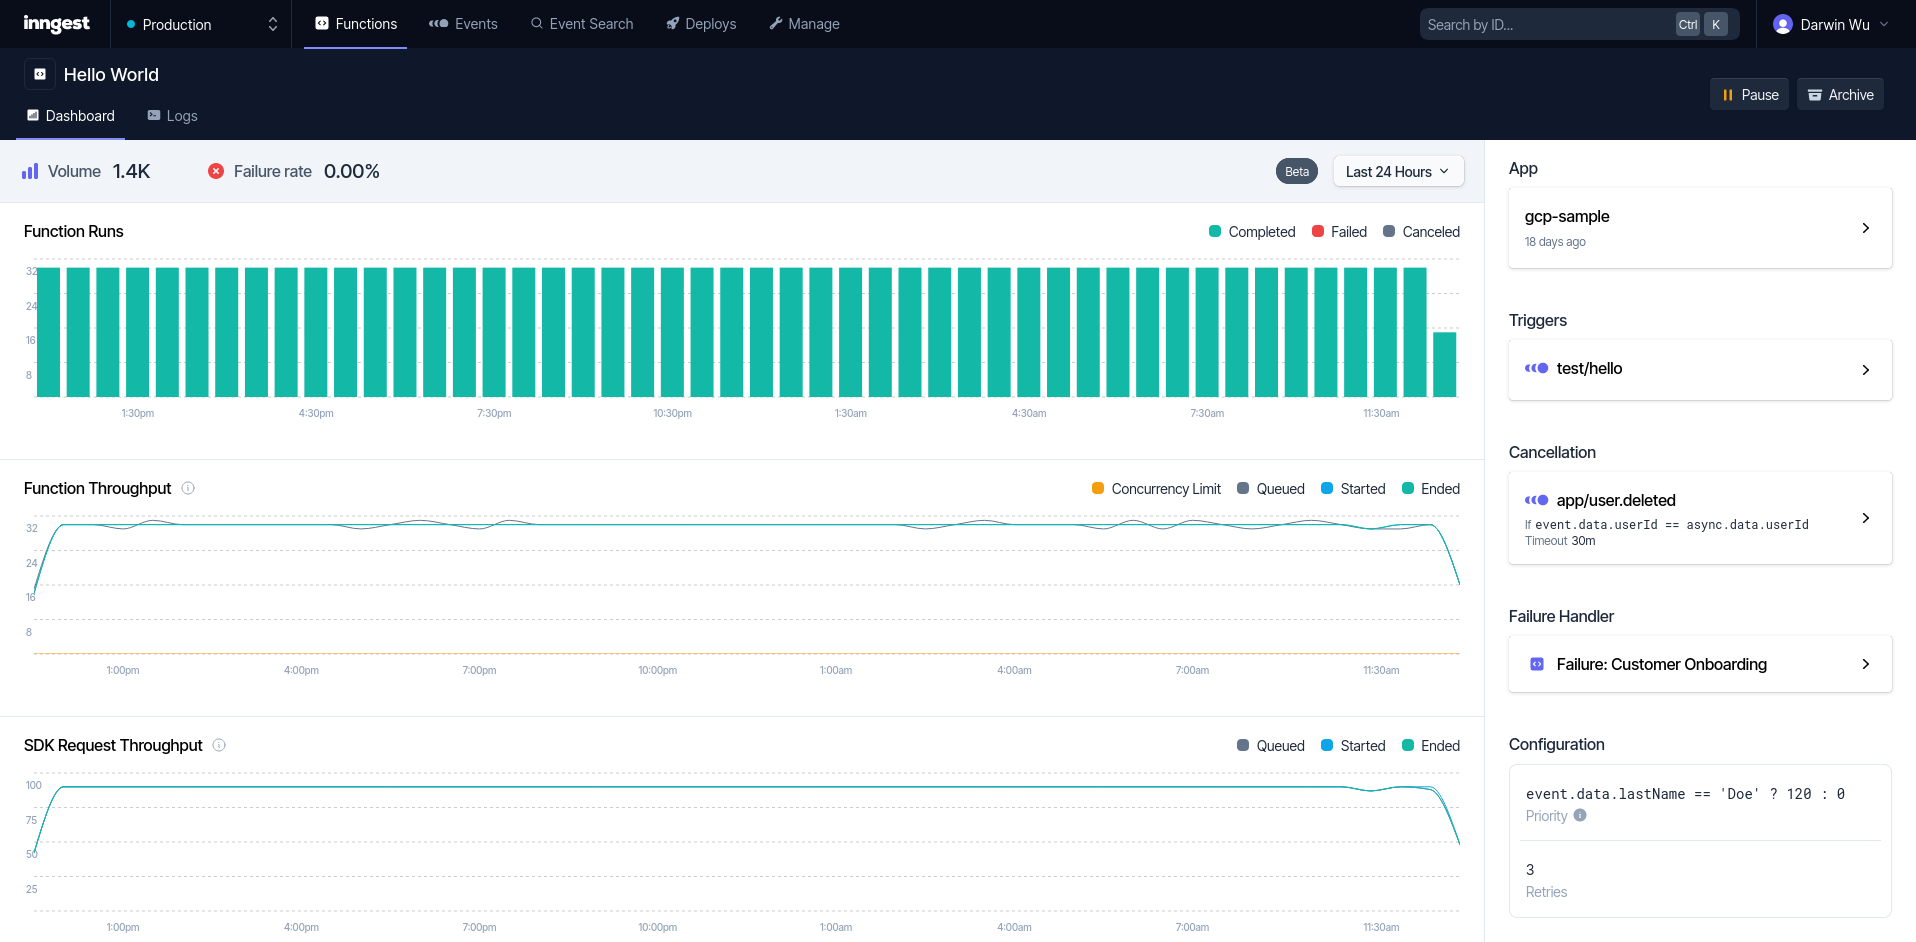
It was pretty clear what we wanted to provide as the MVP release at this point.
- Function throughput
- SDK throughput
- Throttle (Concurrent limit) indicators
And the chart will give the user enough information for them to dive in more on their own to the problem.
How to store the data?
When it comes to storing time series data, there are a couple ways of doing it.
- Keep it dumb, store each entry as a record
- The prometheus style, Counter, Gauges, Histograms…
- Store the data as a flat, schema agnostic structure
#3 is the most ideal, in terms of storing large amounts of data, and also querying them. It’s the closest form to raw outputs and it’s easier to slice and dice the data. Also easier to separate the query engine and the data storage, which results in more effective compute and storage resource utilization1.
However, at this iteration we went with option #2 instead.
Mainly because,
- Timescale is not a columnar database, querying massive amounts of data will incur penalties2
- A future possible feature to expose metrics endpoints for each account, and this format was easier
- The Go tally library has a nice way of extending it to work with custom storage, and saves us time to release
- #3 requires more involved technical work, which unfortunately we do not have the capacity and time right now
To give an idea what I’m talking about, here’s what a typical tally metric recording look like
metrics.Tagged(
	metrics.WithAccountID(id.AccountID.String()),
	metrics.WithEnvironmentID(id.EnvironmentID.String()),
	metrics.WithFunctionID(id.FunctionID.String()),
).Counter(timescale.CounterFunctionRunStartedTotal).Inc(1)
which will create a Counter for FunctionRunStartedTotal if it doesn't exist, and increment the Counter.
We can leverage this easily by providing a custom reporter like this.
type metricsReporter struct {
	cachedCounters *CachedCounters
}

func (r metricsReporter) ReportCounter(name string, tags map[string]string, value int64) {
	ctx := context.Background()
	now := time.Now()

	host, err := os.Hostname()
	if err != nil {
		log.From(ctx).Err(err).Msg("failed to retrieve host value")
		return
	}

	val, err := updateCounter(r.cachedCounters, &CounterMetric{Name: name, Tags: tags, Value: value})
	if err != nil {
		log.From(ctx).
			Err(err).
			Str("metric", name).
			Int64("value", value).
			Interface("tags", tags).
			Msg(fmt.Sprintf("failed to update counter metric: %s", name))
		return
	}

	tagsWithHost := mergeTags(tags, map[string]string{"host": host})

	metric := metricspb.Counter{
		Name:  name,
		Tags:  tagsWithHost,
		Value: val,
		Ts:    timestamppb.New(now),
	}

  // recordCounter will write the data to TimescaleDB
	if err := recordCounter(ctx, &metric); err != nil {
		log.From(ctx).
			Err(err).
			Str("metric", name).
			Int64("value", value).
			Interface("tags", tags).
			Msg(fmt.Sprintf("error recording counter metric: %s", name))
	}
}

// more code...
All we need to care about now is to make sure recordCounter can map the metrics correctly to the database tables when writing to it, instead of having to figure out all the details like,
- handle mapping of metrics with tags
- atomic operations for counters, gauages, etc
Architecture
This is what the overall structure looks like,
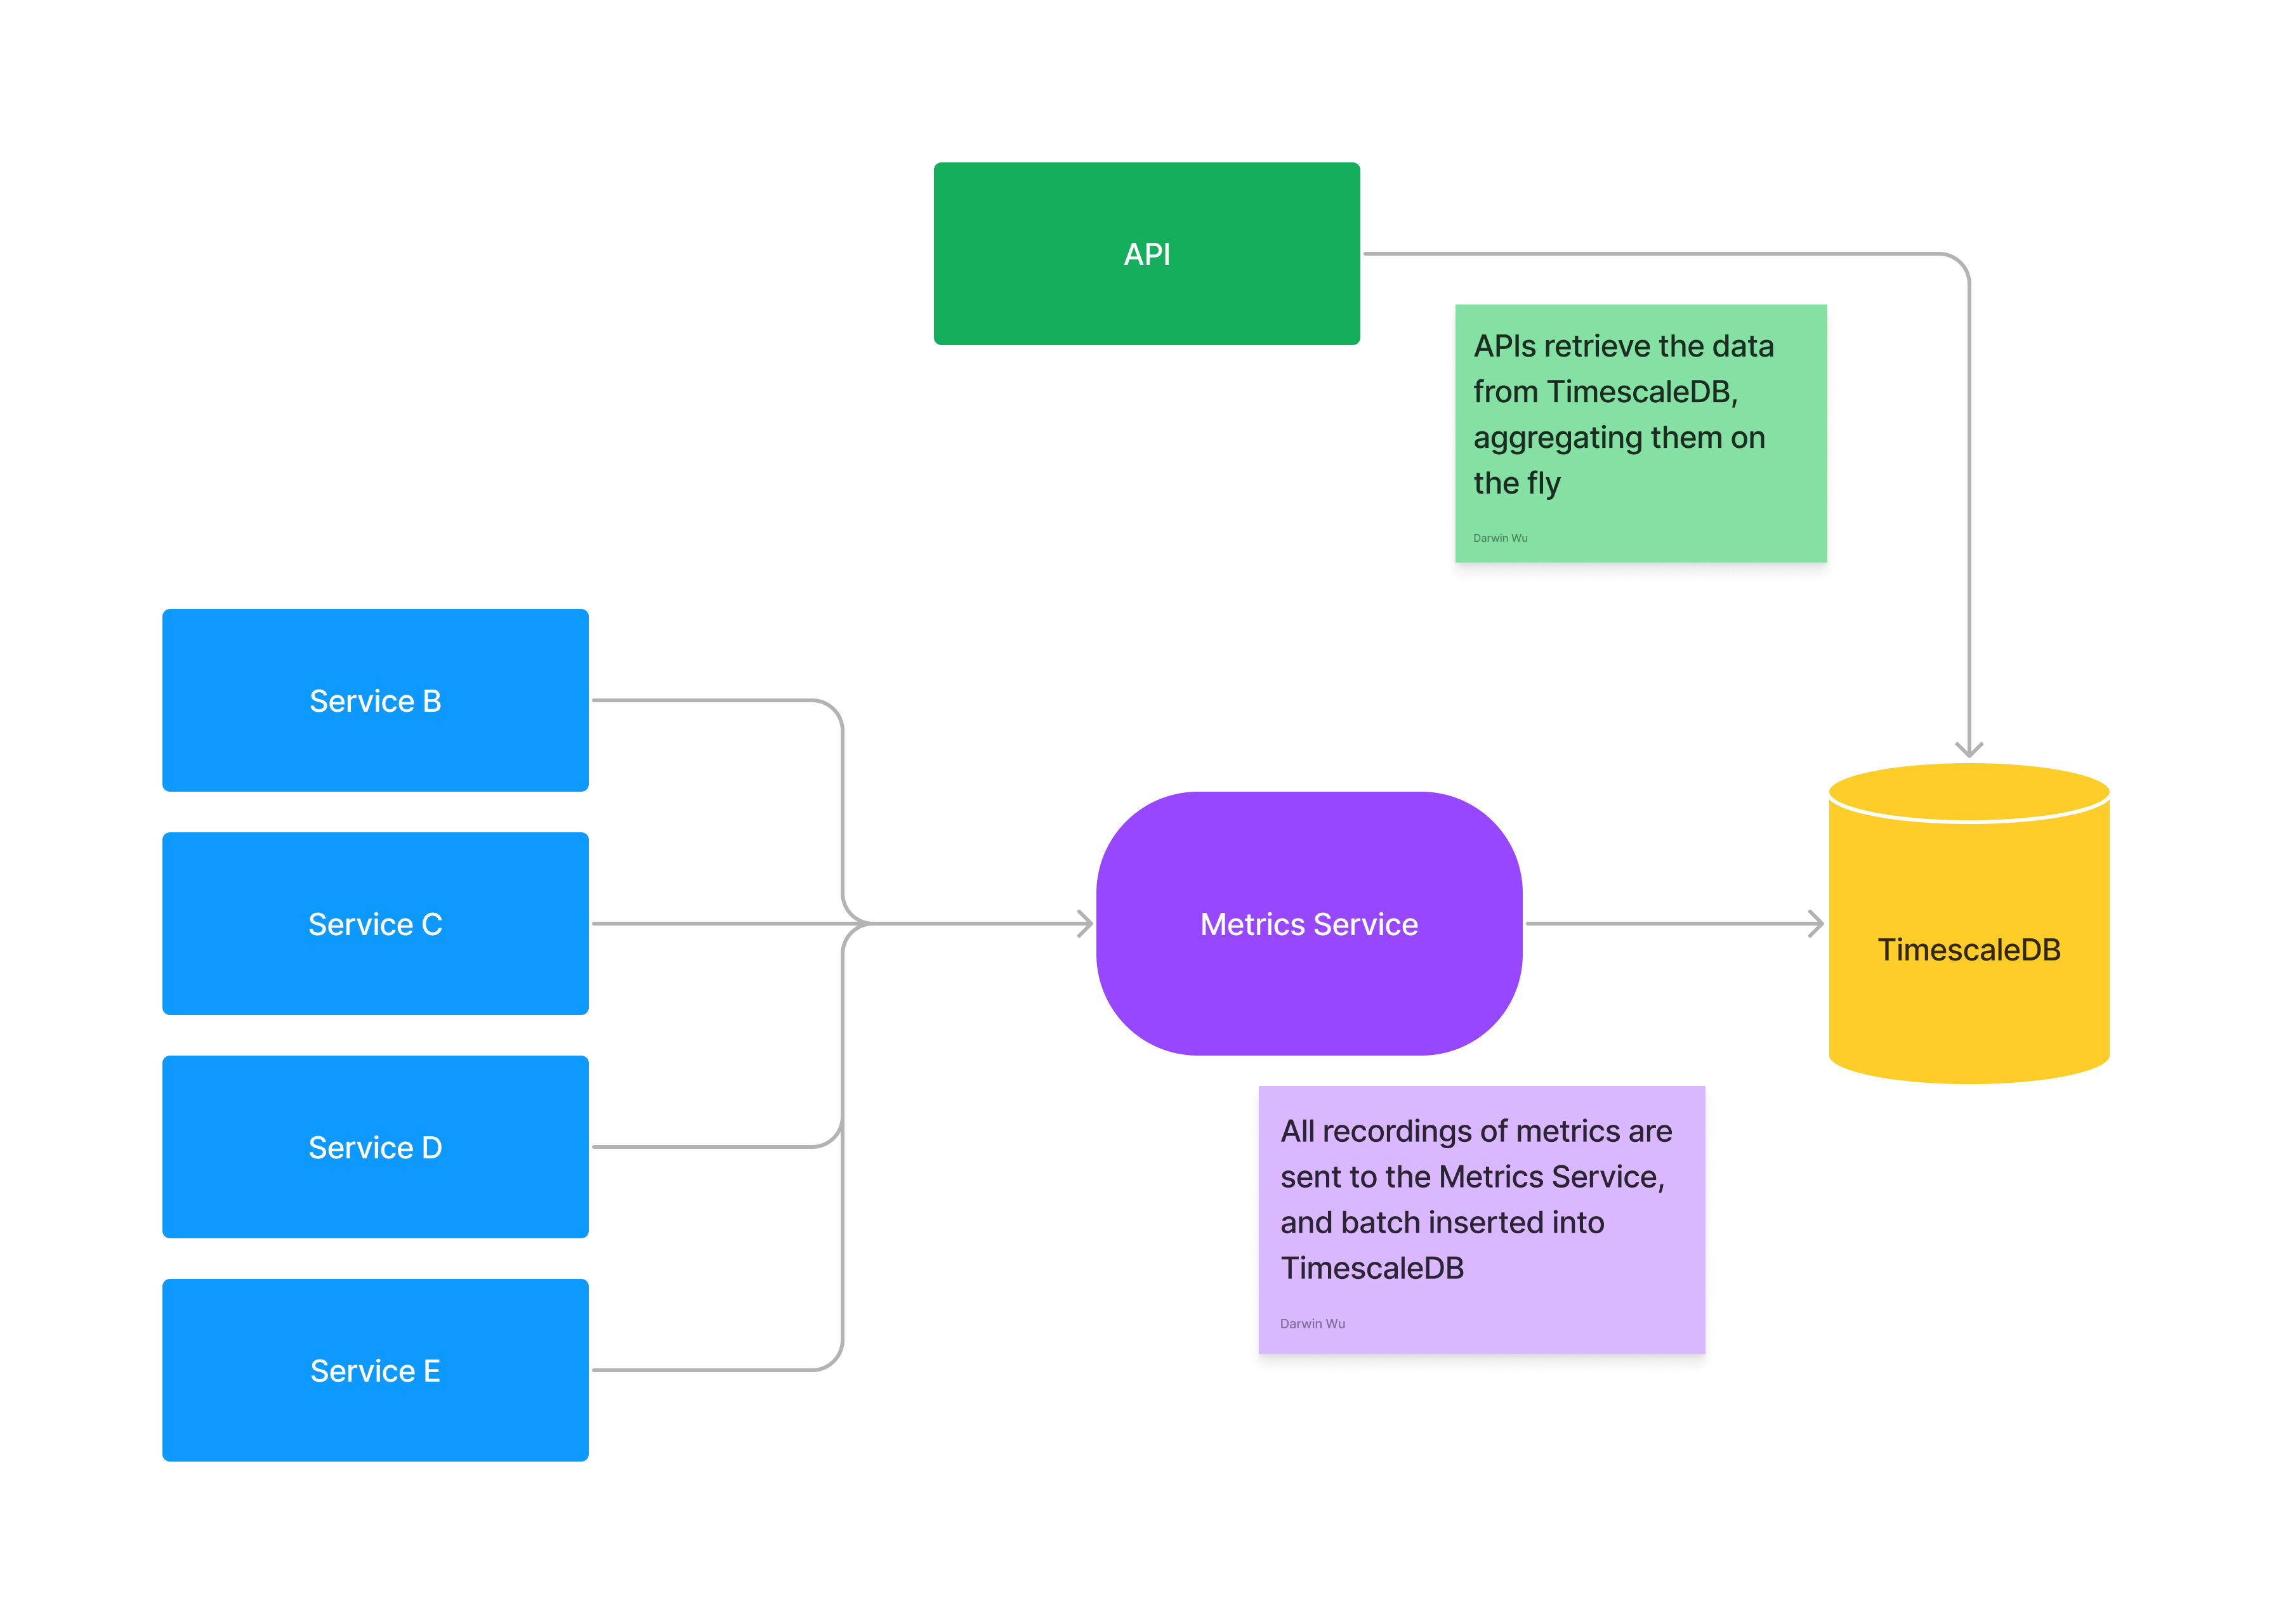
Nothing uncommon here as this is a pretty common service design. The metrics server is there mainly to make sure Timescale is not overwhelmed by the number of connections as our other services that want to record metrics scales up and down.
While there are improvements that can be made, this has been working pretty well regardless of the amount of load (including huge spikes) we’re getting.
Challenges
It’s not all sunshine and roses, and besides where’s the fun when everything goes too well?
Continuous aggregates
One of the biggest challenges we had was Timescale’s continuous aggregate feature.
Due to some technical limitations, Timescale cannot run continuous aggregates on queries that involve window functions.
In our case, we were testing out the counter & gauge aggregators to compute differences between counters and gauges.
WITH
  agg AS (
    SELECT
      account_id,
      environment_id,
      function_id,
      counter_agg(time, counter) AS summary,
      time_bucket_gapfill(INTERVAL '30 minutes', time) AS bucket
    FROM
      function_run_scheduled_total
    WHERE
      function_id = '?' AND time >= NOW() - INTERVAL '1 day' AND time <= NOW()
    GROUP BY
      bucket,account_id,environment_id,function_id
  )

SELECT
  bucket,
  account_id,
  environment_id,
  function_id,
  interpolated_delta(summary, bucket, INTERVAL '30 minutes')
FROM
  agg
ORDER BY
  bucket DESC
The aggregate functions can give you a rough idea of what’s going on, but the numbers are widely inaccurate, sometimes in the multiples of 3 or more, where the result of the aggregate will show 10, but the actual difference was 30.
Prometheus has a similar problem, but it’s not as big of a deal if you’re only dealing with internal systems. For our users, the numbers need to be accurate in order to be able to tackle issues or else any approach to solving issues will be flawed due to the shaking foundation.
As a result we have to rely on Postgres’ windowing functions to compute the differences between counters by partitions.
WITH
  base AS (
    SELECT
      account_id,
      environment_id,
      function_id,
      time,
      host,
      value,
      -- NOTE: Calculating diff compared with the previous record value
      value - LAG(value, 1, 0) OVER (PARTITION BY account_id,environment_id,function_id,host ORDER BY time) as diff_val
    FROM
      function_run_scheduled_total
    WHERE
      function_id = '?' AND time >= NOW() - INTERVAL '1d2h'
  ),
  final AS (
    SELECT
      account_id,
      environment_id,
      function_id,
      time,
      CASE
        WHEN diff_val >= 0 THEN diff_val
        ELSE value
      END AS diff
    FROM
      base
  )

SELECT
  time_bucket_gapfill (INTERVAL '30 minutes', time) AS bucket,
  account_id,
  environment_id,
  function_id,
  COALESCE(SUM(diff), 0) AS count
FROM
  final
WHERE
  time >= NOW() - INTERVAL '1 day' AND time <= NOW()
GROUP BY
  bucket, account_id, environment_id, function_id
ORDER BY
  bucket DESC
What am I talking about? Let's take a closer look.
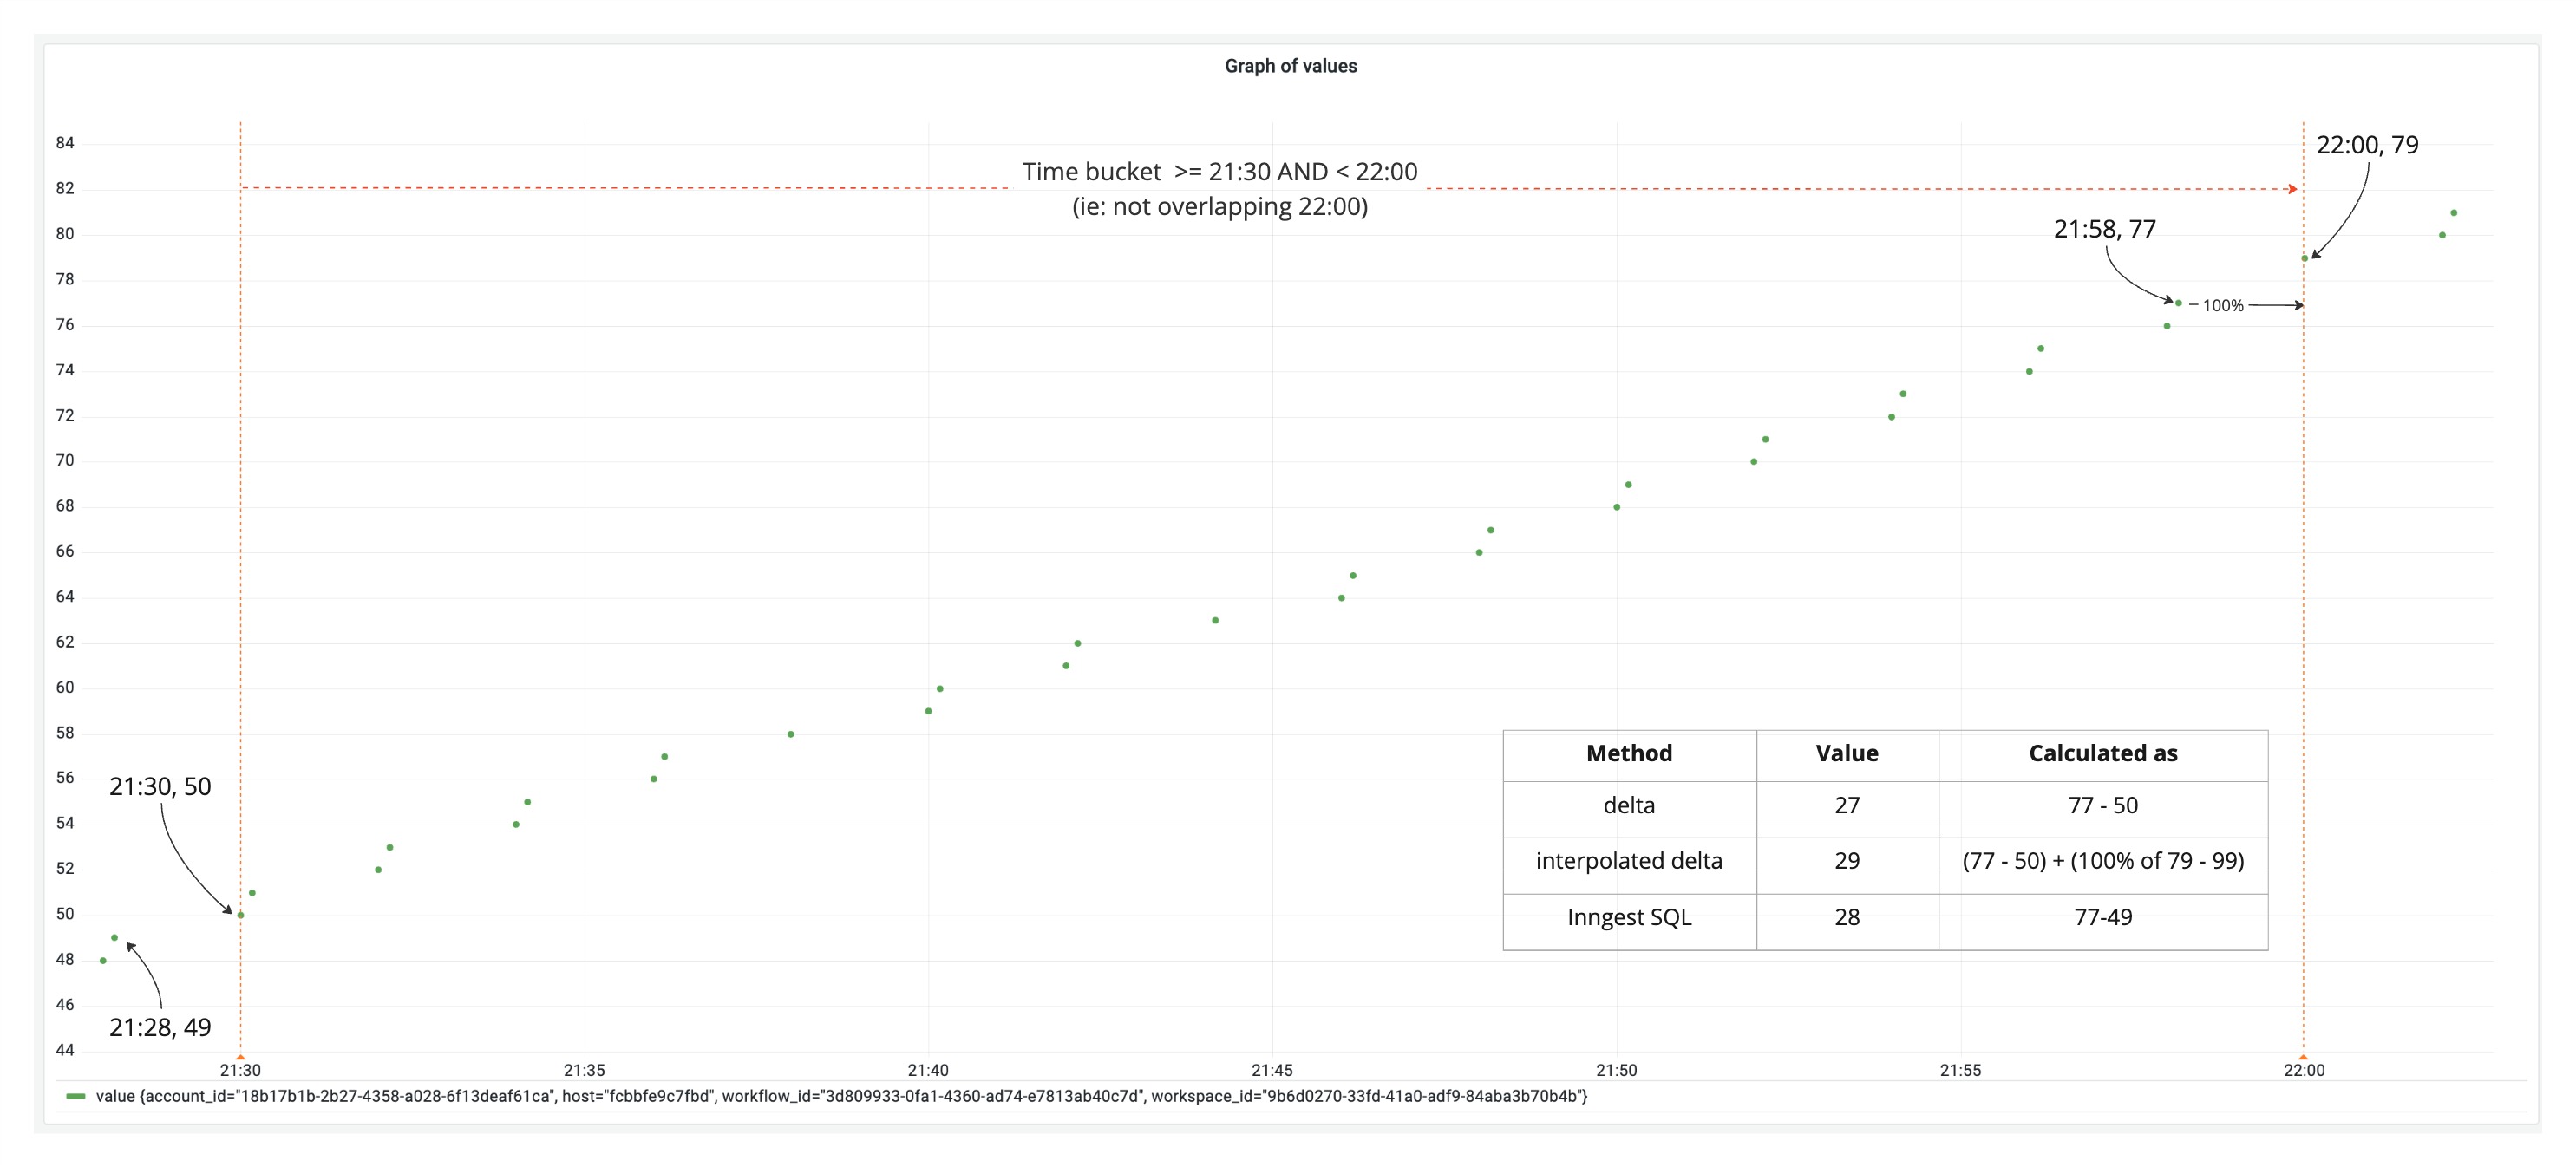
The screenshot above shows an example when inspecting deltas with different methods for a specific metric.
The goal here is calculate the difference between the last value of the current bucket and the previous bucket. In other words,
diff = prev ? current - prev : current;
When attempting to calculating the difference using delta or interpolated_delta aggregate functions, both are off from the actual value by +1 or -1.
Because delta is not considering the previous bucket's last value, and interpolated_delta is taking into account the value at the end of the bucket that shouldn't be included.
Though the difference is small when inspecting one metric, when data is aggregated across multiple metrics (even one counter metric for a function can have multiple variants because they run on different hosts, hence under different contexts),
the slight difference of 1 will grow to something that can't be ignored.
High cardinality
Another problem we have is high cardinality when it comes to metric tags. This is a common issue and exists in almost every solution out there. The higher the cardinality of the metric, the harder it is to be inspected, queried or utilized because the cost of querying against it is very high.
And this actually showed even in our metrics library tally. Our initial scope for SDK throughputs was to also record the RunIDs so we can provide the capability for users to be able to see the metrics for specific function runs.
And because RunIDs are unique for every single function run, the cardinality is extremely high. As we were rolling out the metrics recording, we started seeing our containers’ memory usage grow extremely fast, and would eventually OOM if left as-is.
The reason is because tally keeps an internal map of the metrics being tracked with their tags. So each function RunID will grow the memory size a tiny bit, but considering the amount of functions we’re running, this gets out of hand very quickly.
We have no choice but to stop recording RunIDs for function runs, and reset the related metrics tables.
Removing tags
If you’ve used Prometheus before, you’ve probably noticed that a change of tags of a metric will result in a new metric being created, and the old one will slowly fade away into the ether. Because we went with the pattern created/spreaded by Prometheus, we inherently have a similar problem.
For example,
We have no choice but to stop recording RunIDs for function runs, and reset the related metrics table.
Earlier when I was talking about high cardinality, I mentioned we need to remove the RunID from the metrics tag, and need to reset, and here’s why.
If you take a look at the window function SQL code again, you’ll see something like this,
value - LAG(value, 1, 0) OVER (PARTITION BY account_id,environment_id,function_id,host ORDER BY time) as diff_val
RunID was one of those fields that were initially used as a partition, and removing it will mean that existing partitions will become invalid, and can no longer be used. Why?
Because in order to calculate the delta accurately, we need to make sure the window function operates under the correct context.
Take the following metrics as examples,
metrics_a{msg=”hello world”, status=”success”} 300
metrics_a{msg=”hello world”, status=”success”} 306
metrics_a{msg=”hello world”, status=”failed”} 303
It’ll make sense to diff between #1 and #2 because they have the same success status, and the delta here will be 6. But there’s no point in trying to diff #1 and #3 because their statuses are different.
Now, what if I take away status from the tags? Since timescale is just Postgres, it means I will be dropping a column, and this is what will become of existing metrics.
metrics_a{msg=”hello world”} 300
metrics_a{msg=”hello world”} 306
metrics_a{msg=”hello world”} 303
Now, because we’ve lost the context of status, calculating the deltas for all these metrics will become wildly inaccurate because you can be calculating the diffs with a metric record that previously you wouldn't do when status existed.
Because of this behavior, we needed to abandon the table, in this case, truncate it since the data are no longer usable from the date of the change.
This is a consequence of the technical choice we’ve made, and unfortunately there’s not much leeway to work around it3.
Thoughts
Developing with TimescaleDB and using Timescale's cloud offering has been a pretty pleasant experience so far. The fact that it’s just Postgres behind the scenes gives us comfort that it’s built on battle tested technology.
The cloud offering also provides good indications of compression, and they have a data tiering option available at the point of writing, so it has saved us a lot of effort in terms of having to operate our own cluster and all the fun things that comes with it.
While there were some challenges, those were more due to the technical choices we made. For what we’ve been trying to do, Timescale has been performing very well, and above all it has allowed us to get something out rather quickly.
Footnotes
-
Uber has a good blog post about this for their logging if you're interested. This can also apply to metrics as they're also just logs in a different format. ↩
-
Although they do seem to have a hybrid vectorization as well if you're interested. ↩
-
There are other ways to smooth the transition, including delete -> update to merge segments or create a new table and record to both at the same time, but truncate was the quickest and most bullet proof method for our need at the time. ↩