
Enhanced observability with Inngest: Waterfall trace view and advanced monitoring
A new era for monitoring durable functions
Cheryl Manalo· 9/26/2024 (Updated: 1/7/2026) · 6 min read
At Inngest, we are constantly evolving to meet the needs of developers building applications with durable execution. Today, we're excited to unveil two significant updates designed to enhance how you monitor, debug, and gain insights into your durable workflows: our new trace experience for runs and a holistic top-down monitoring dashboard. Together, these updates redefine how you interact with your function executions and provide deeper insights into the overall health of your Inngest applications.
A fresh perspective on function execution: The new trace experience for runs
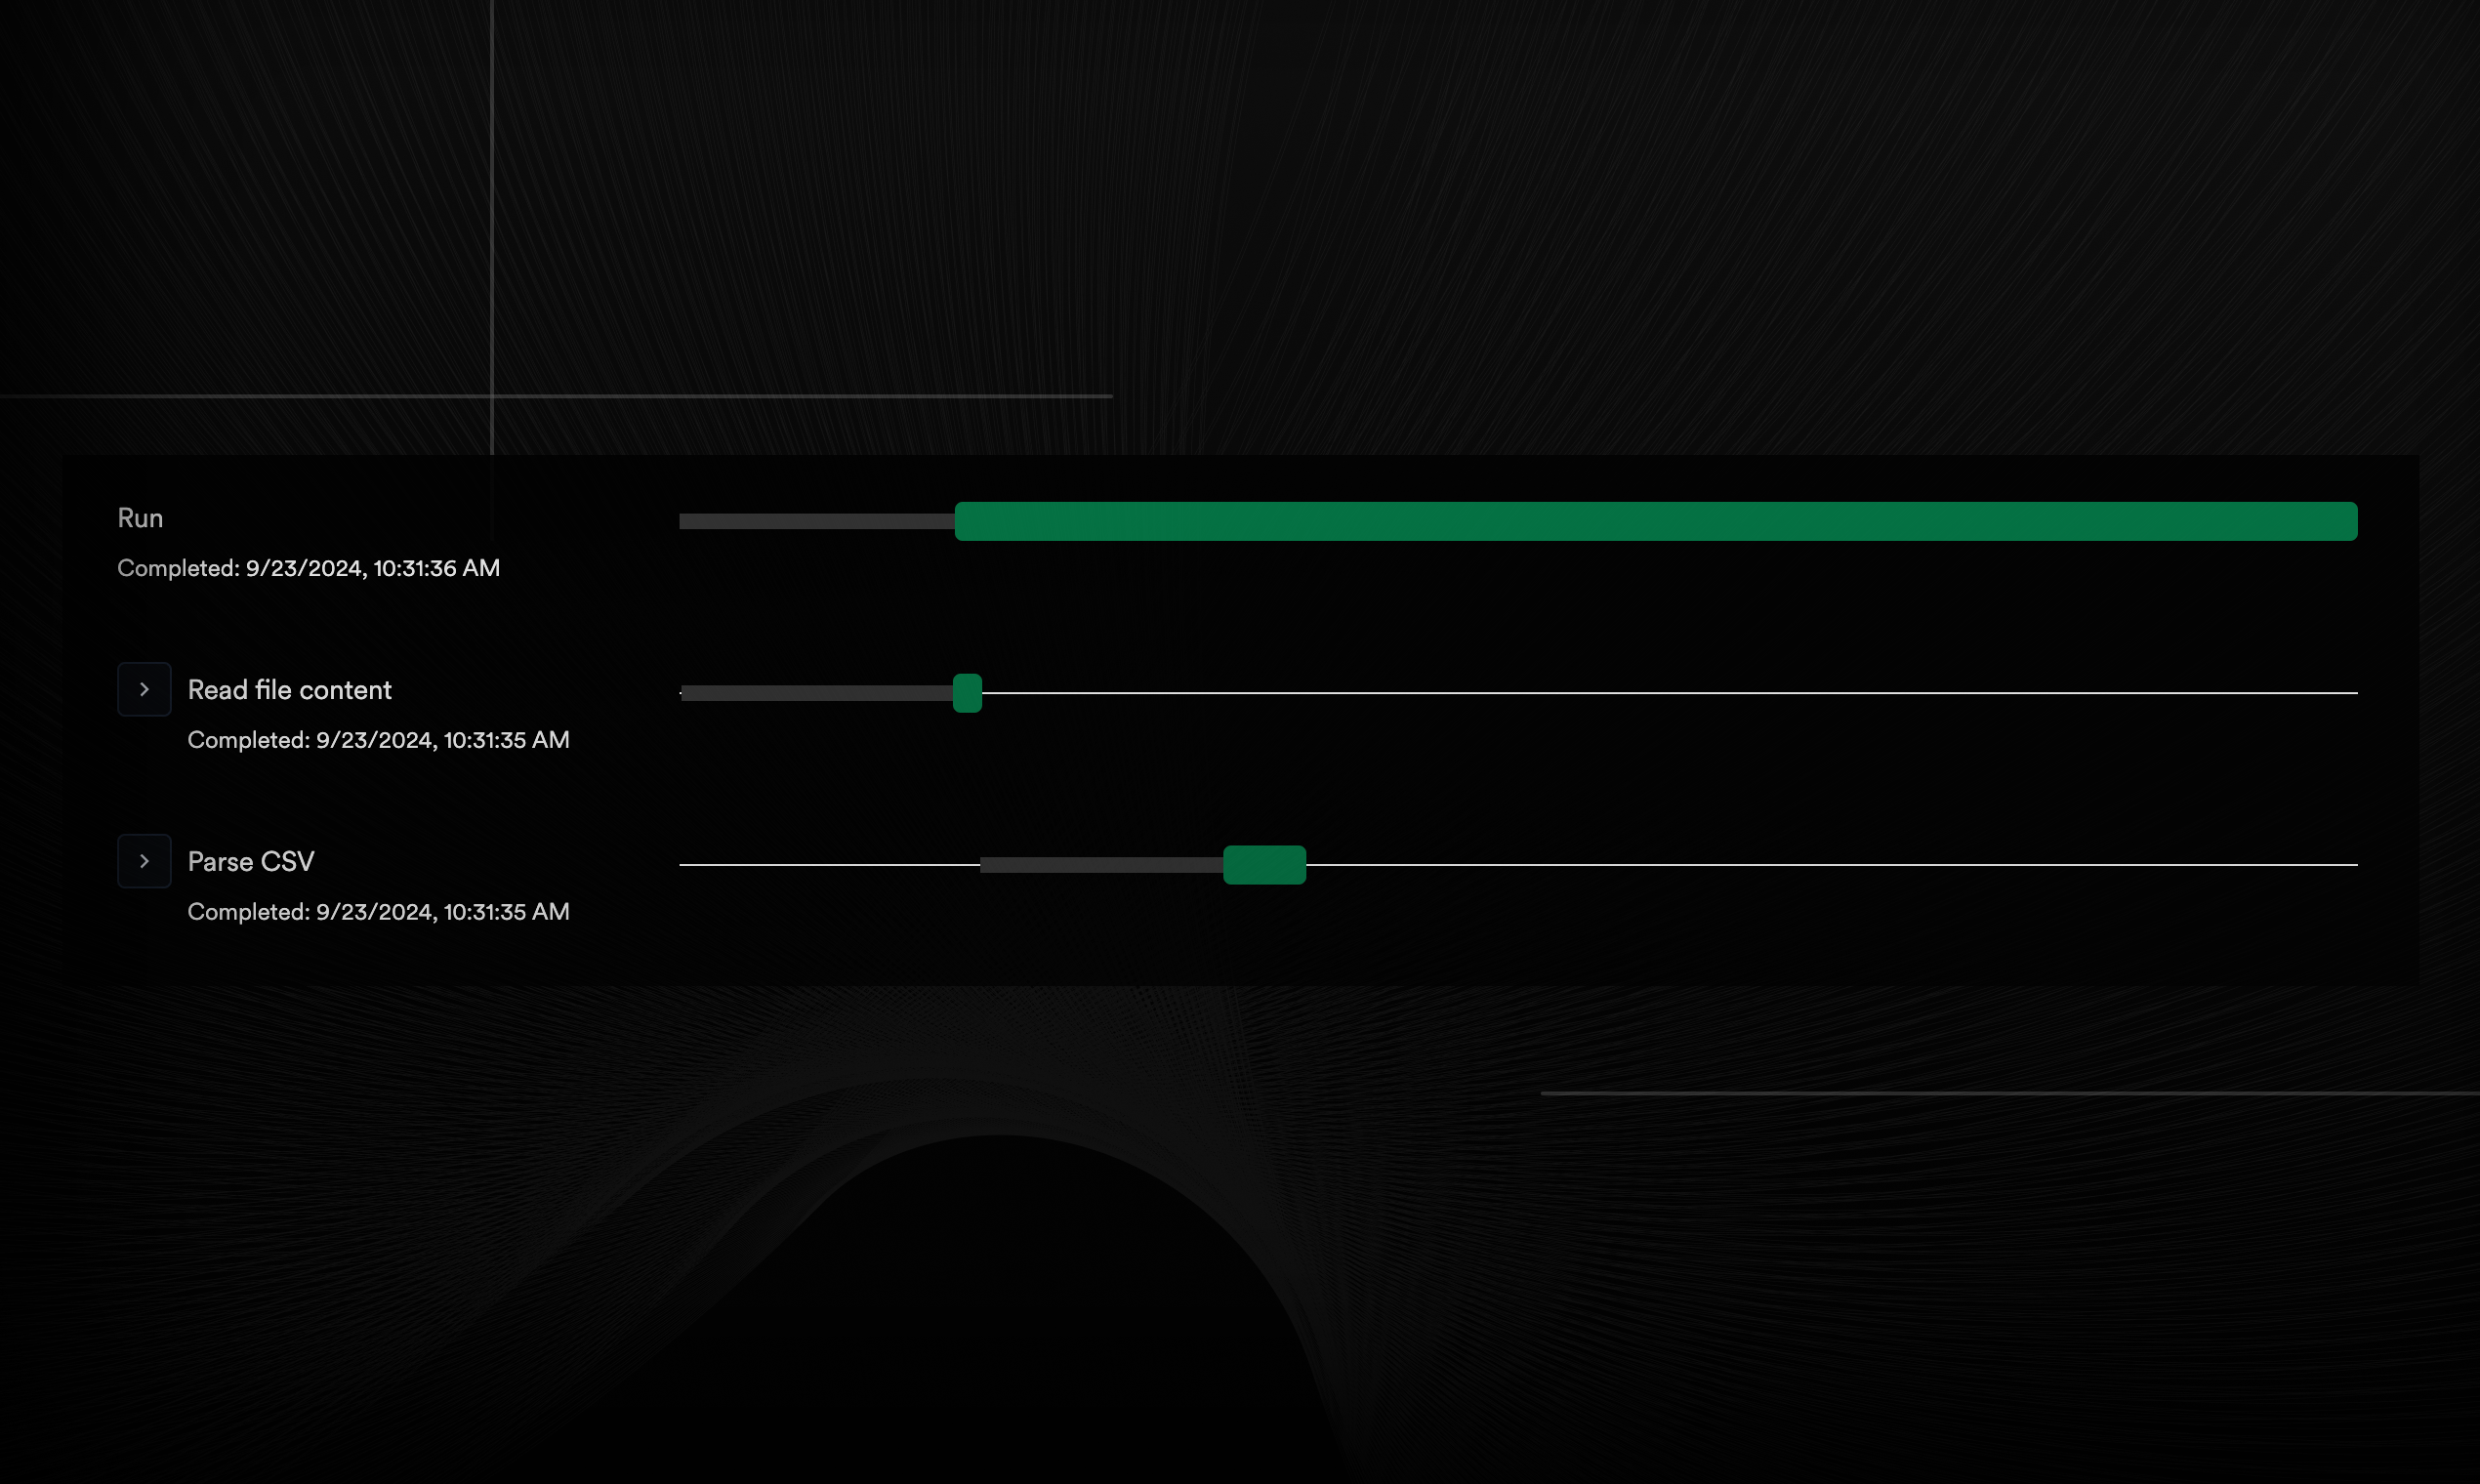
Managing workflows can get complex, especially with parallel steps, concurrency limits, and multiple functions running simultaneously. Previously, our function run view displayed function steps in a vertical timeline, which often made it difficult to grasp the sequence and relationships between steps.
To address this, we've introduced a dynamic waterfall view and expanded run details, inspired by OpenTelemetry tracing. These features make it easier than ever to visualize complex workflows and troubleshoot faster. Here's how they enhance your observability:
- Waterfall visualization: This new trace view clearly maps out the sequence and timing of function executions, including steps running in parallel. You can now understand the flow of your entire workflow in seconds, simplifying navigation and revealing bottlenecks or inefficiencies at a glance.
- Expanded run details: For those who need more granular insights, each run can be expanded within the list for a detailed breakdown, without losing your place in the workflow. This seamless integration between a high-level overview and detailed function execution ensures that you maintain both context and focus.
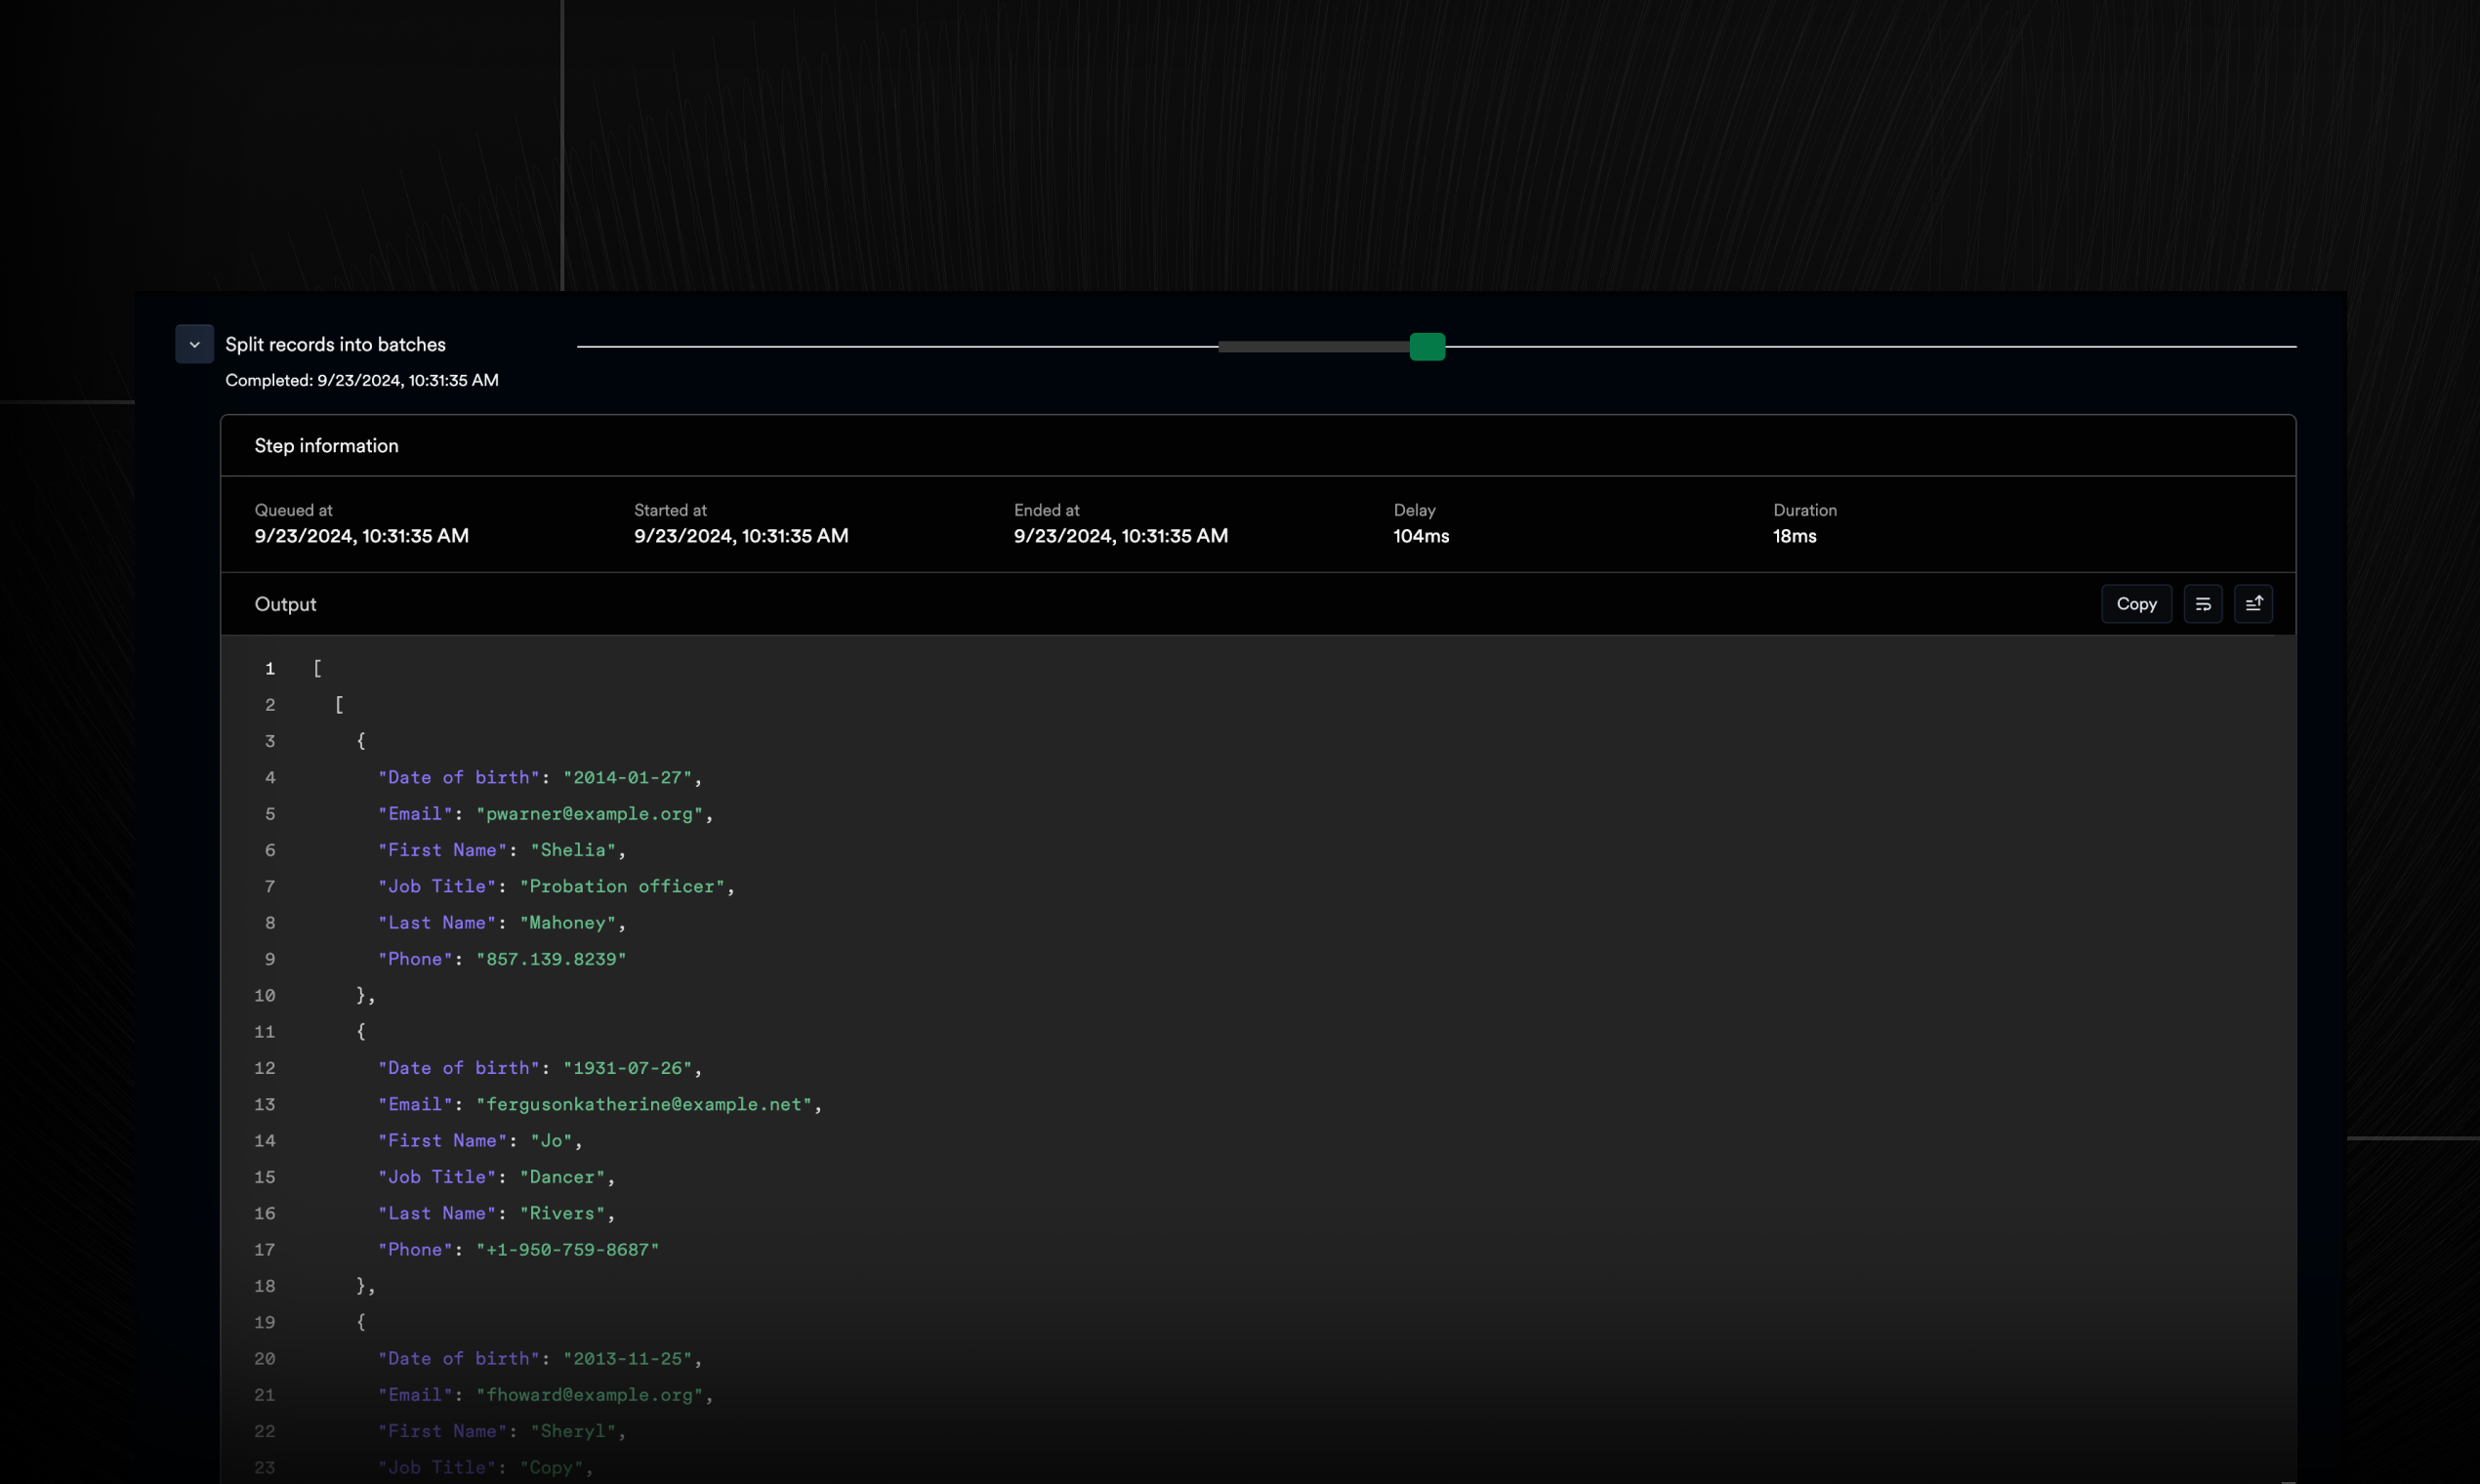
By leveraging the principles of OpenTelemetry for tracing, these updates provide reliable and actionable data that enhance your debugging efficiency. You'll spend less time deciphering execution timelines and more time resolving issues, improving the overall performance and reliability of your applications.
Dashboard monitoring: A holistic view of application health
While Inngest has long offered function-level metrics, many users expressed the need for a higher-level view—one that provides a comprehensive snapshot of the entire application. With this release, we're introducing dashboard monitoring capabilities that offer a bird's-eye view of your system's health.
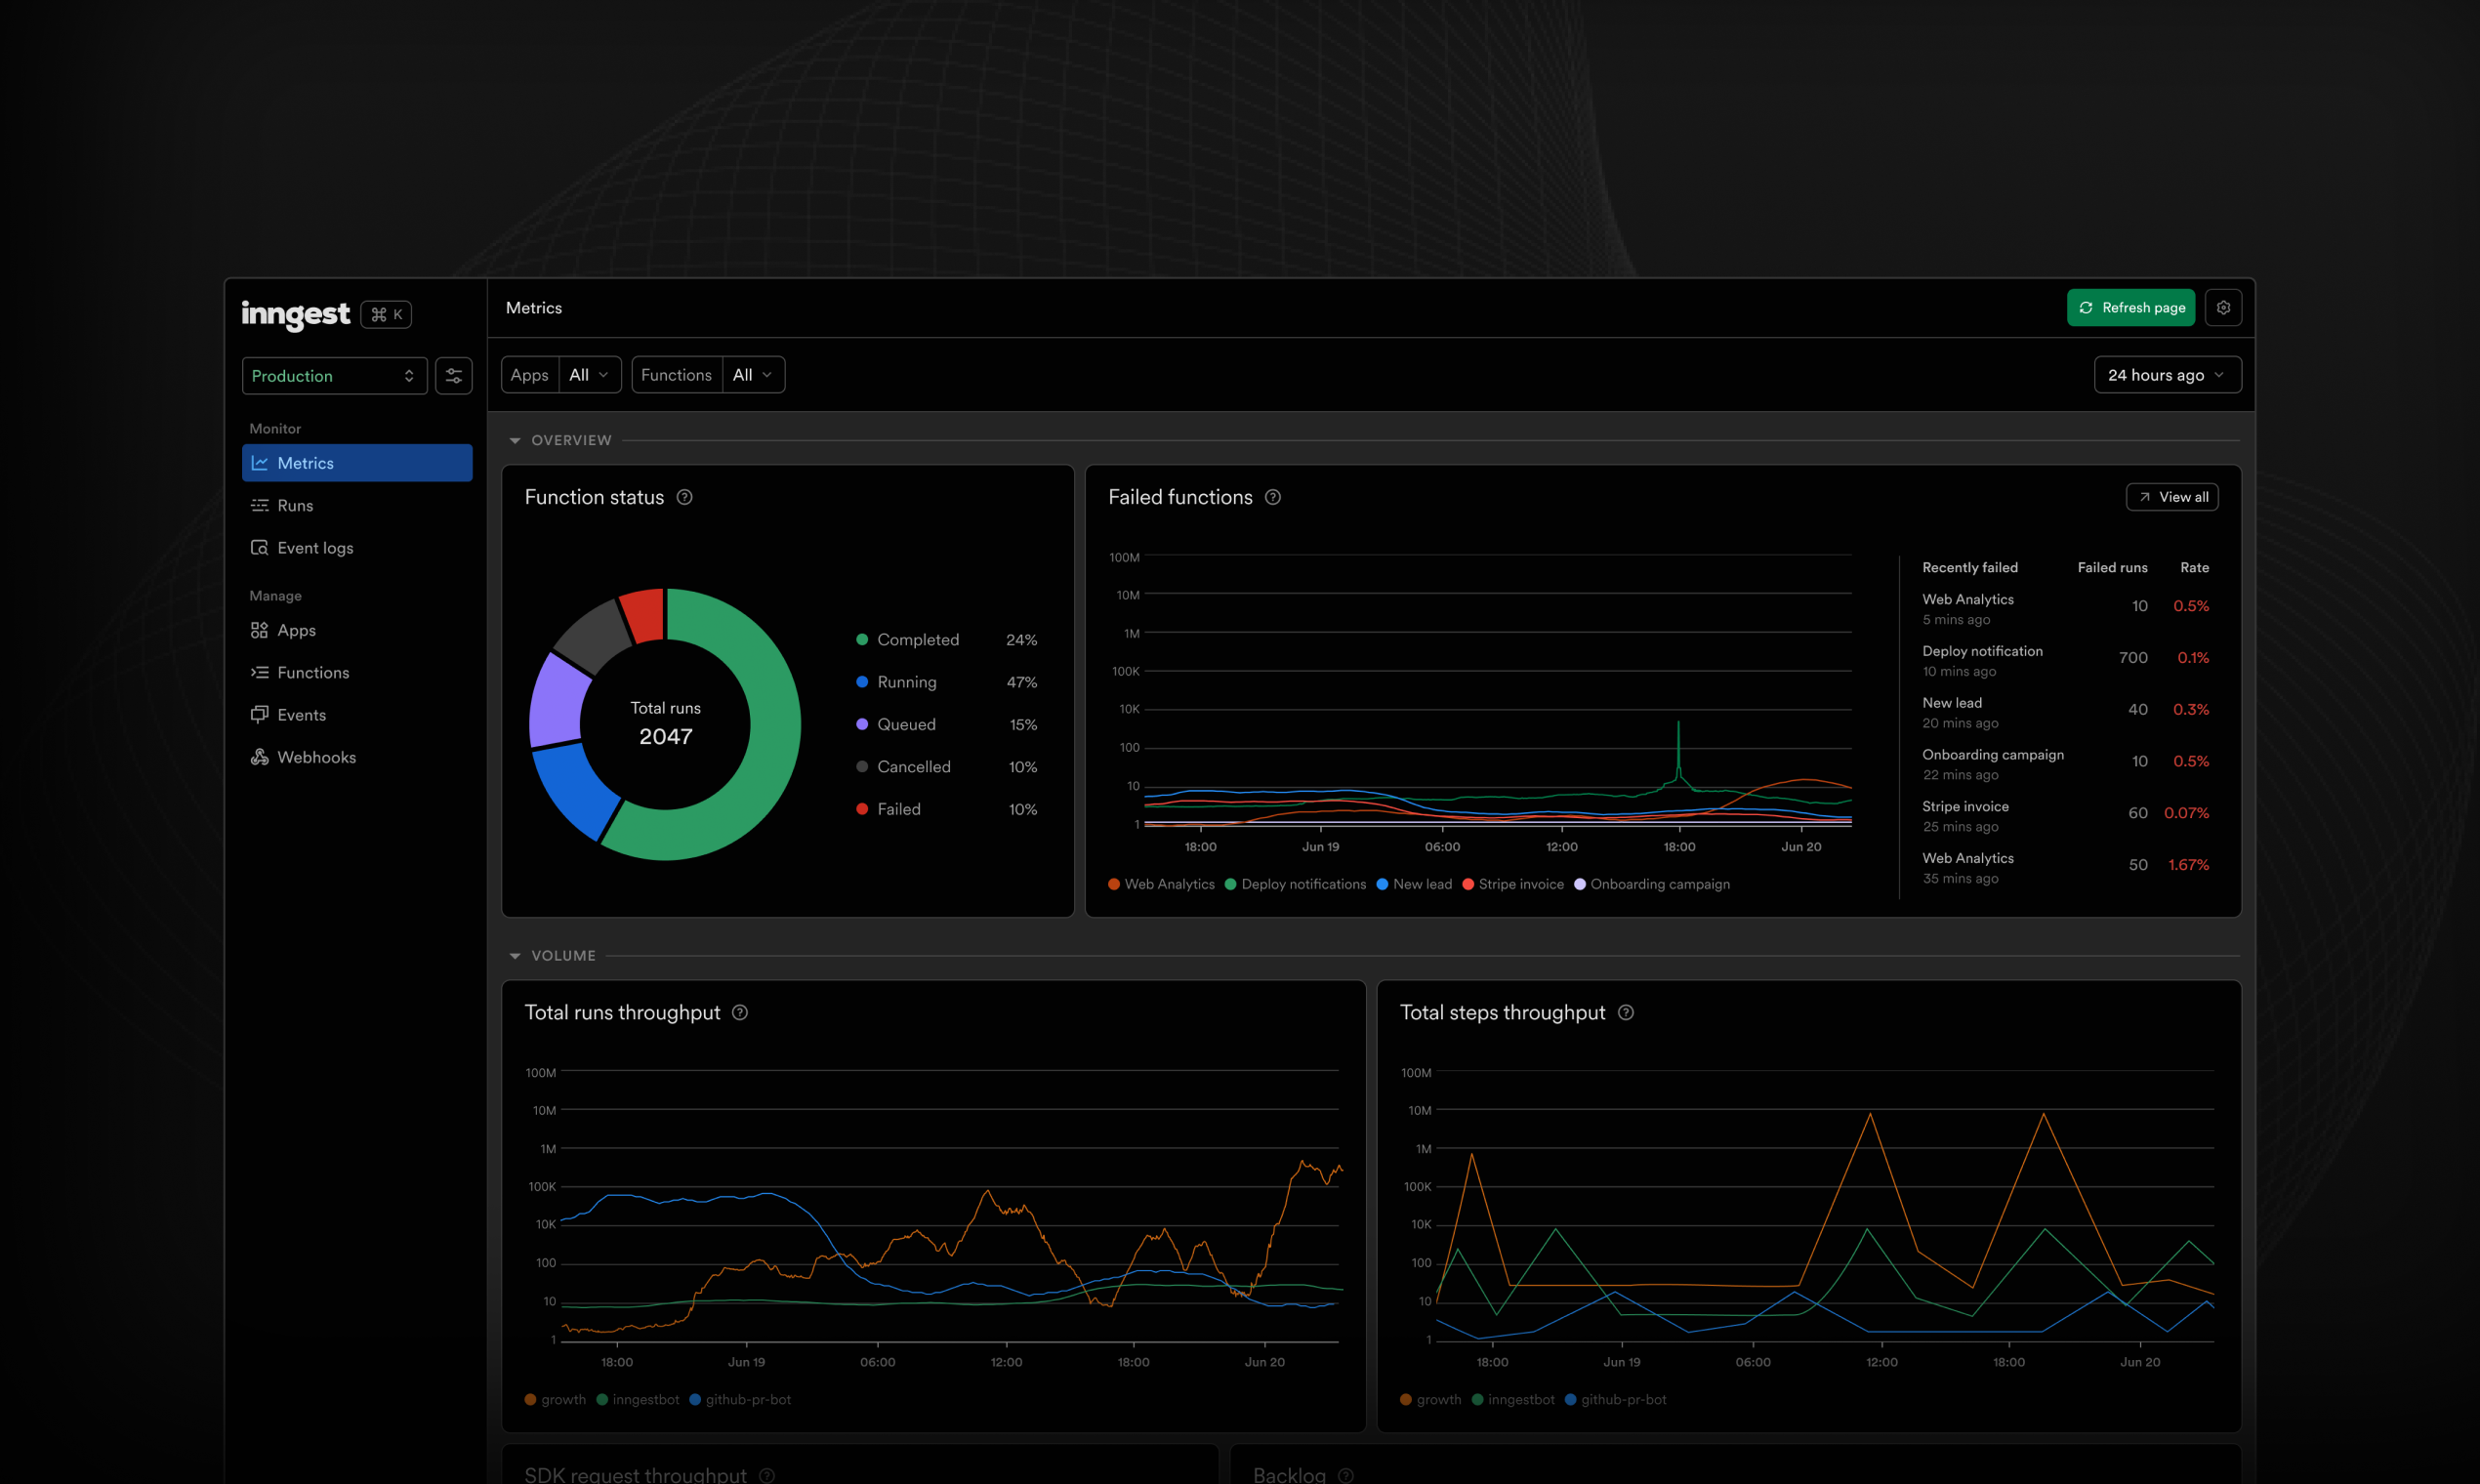
Our new monitoring features are designed to help you quickly identify anomalies across your Inngest applications, from high-level system metrics down to individual function executions. Here's what you can expect:
-
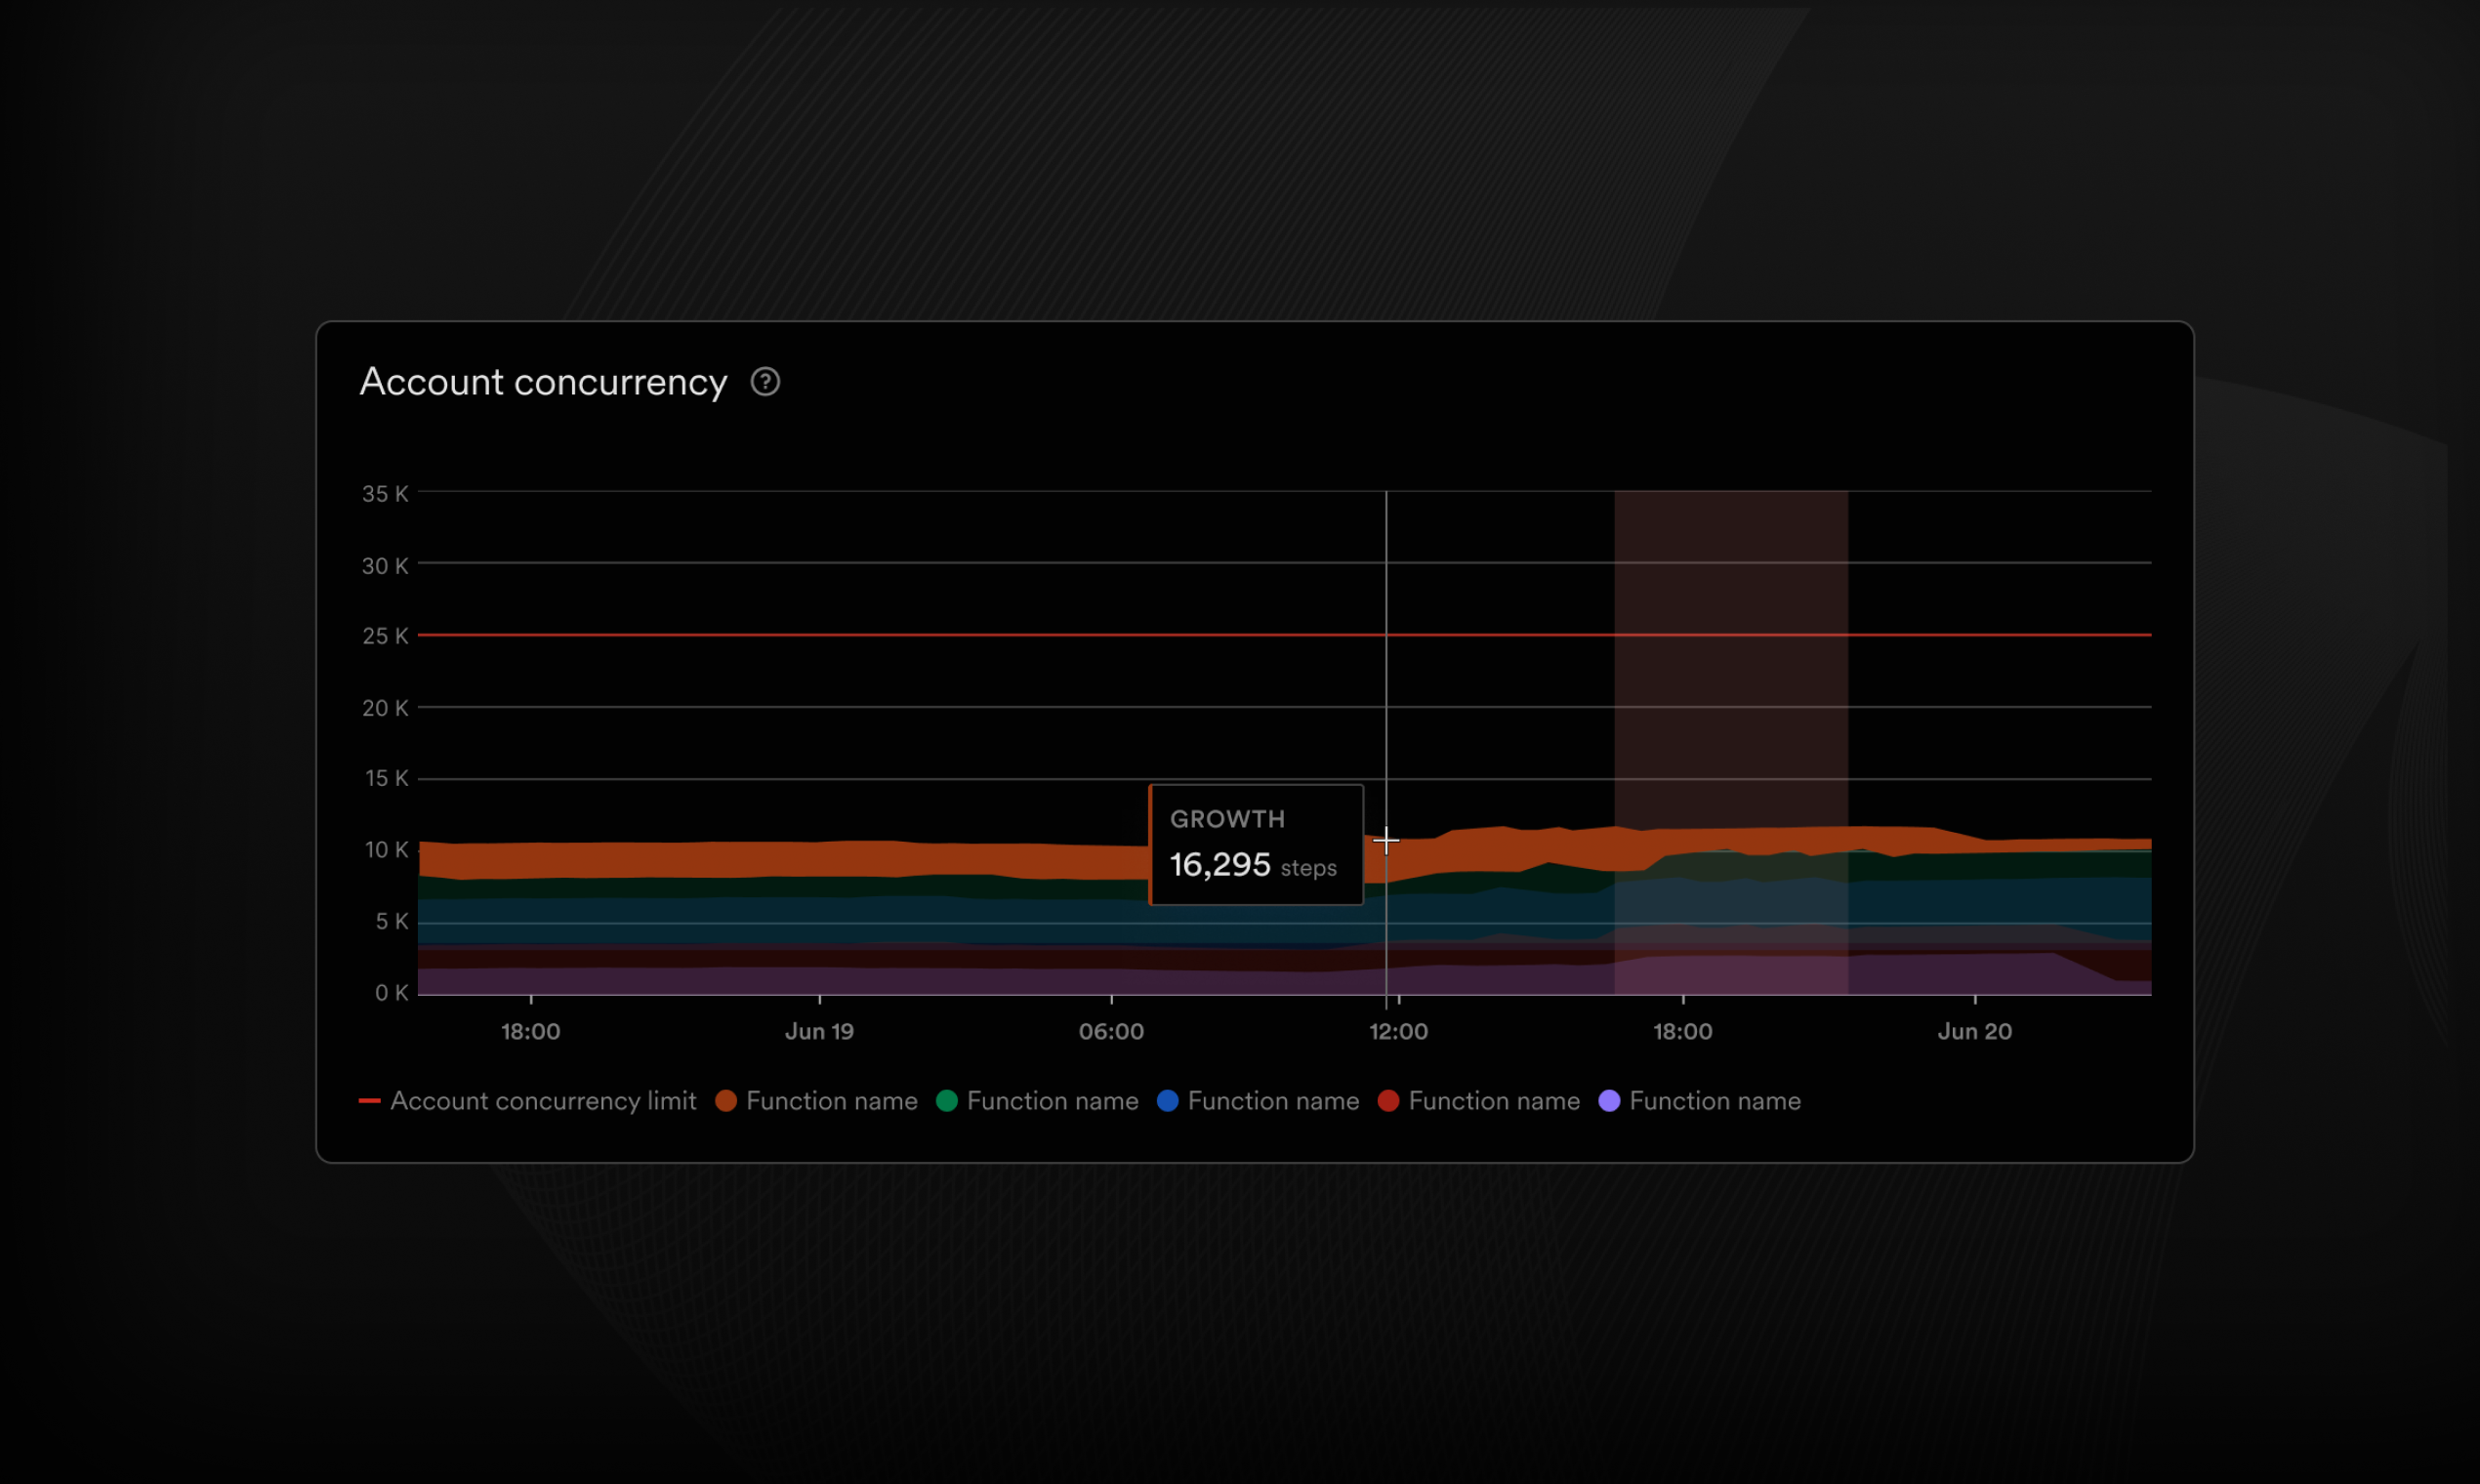
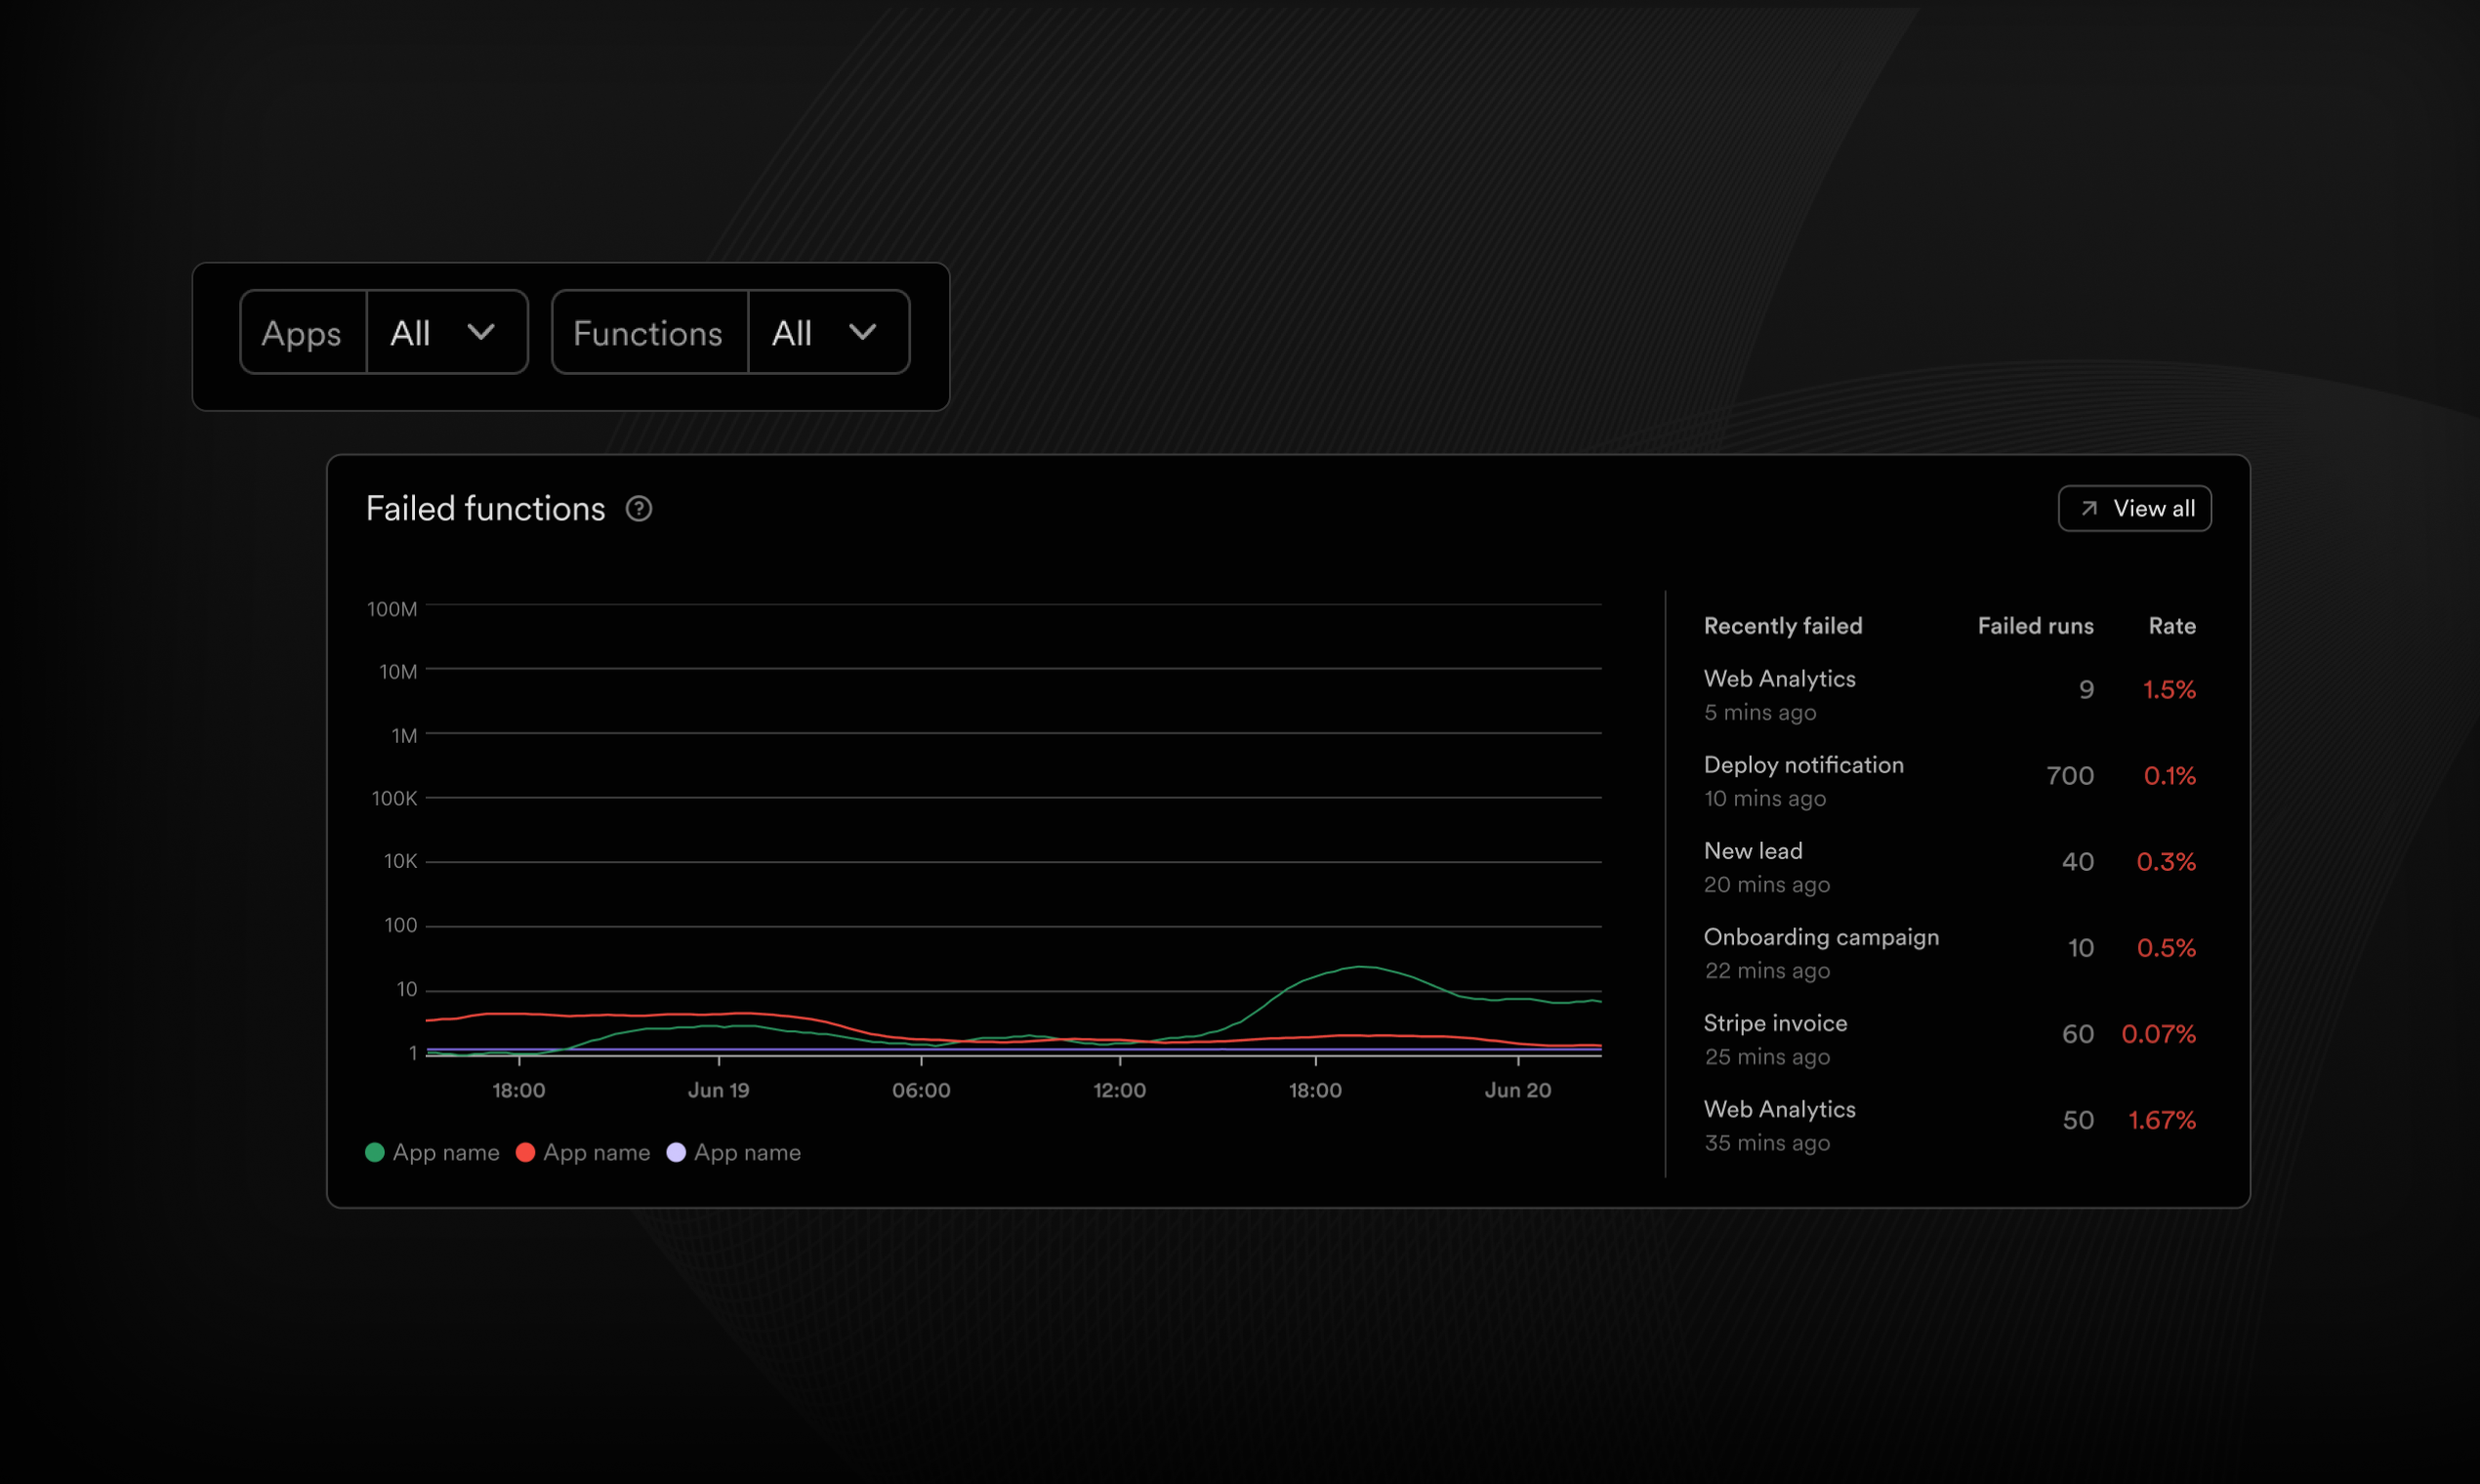
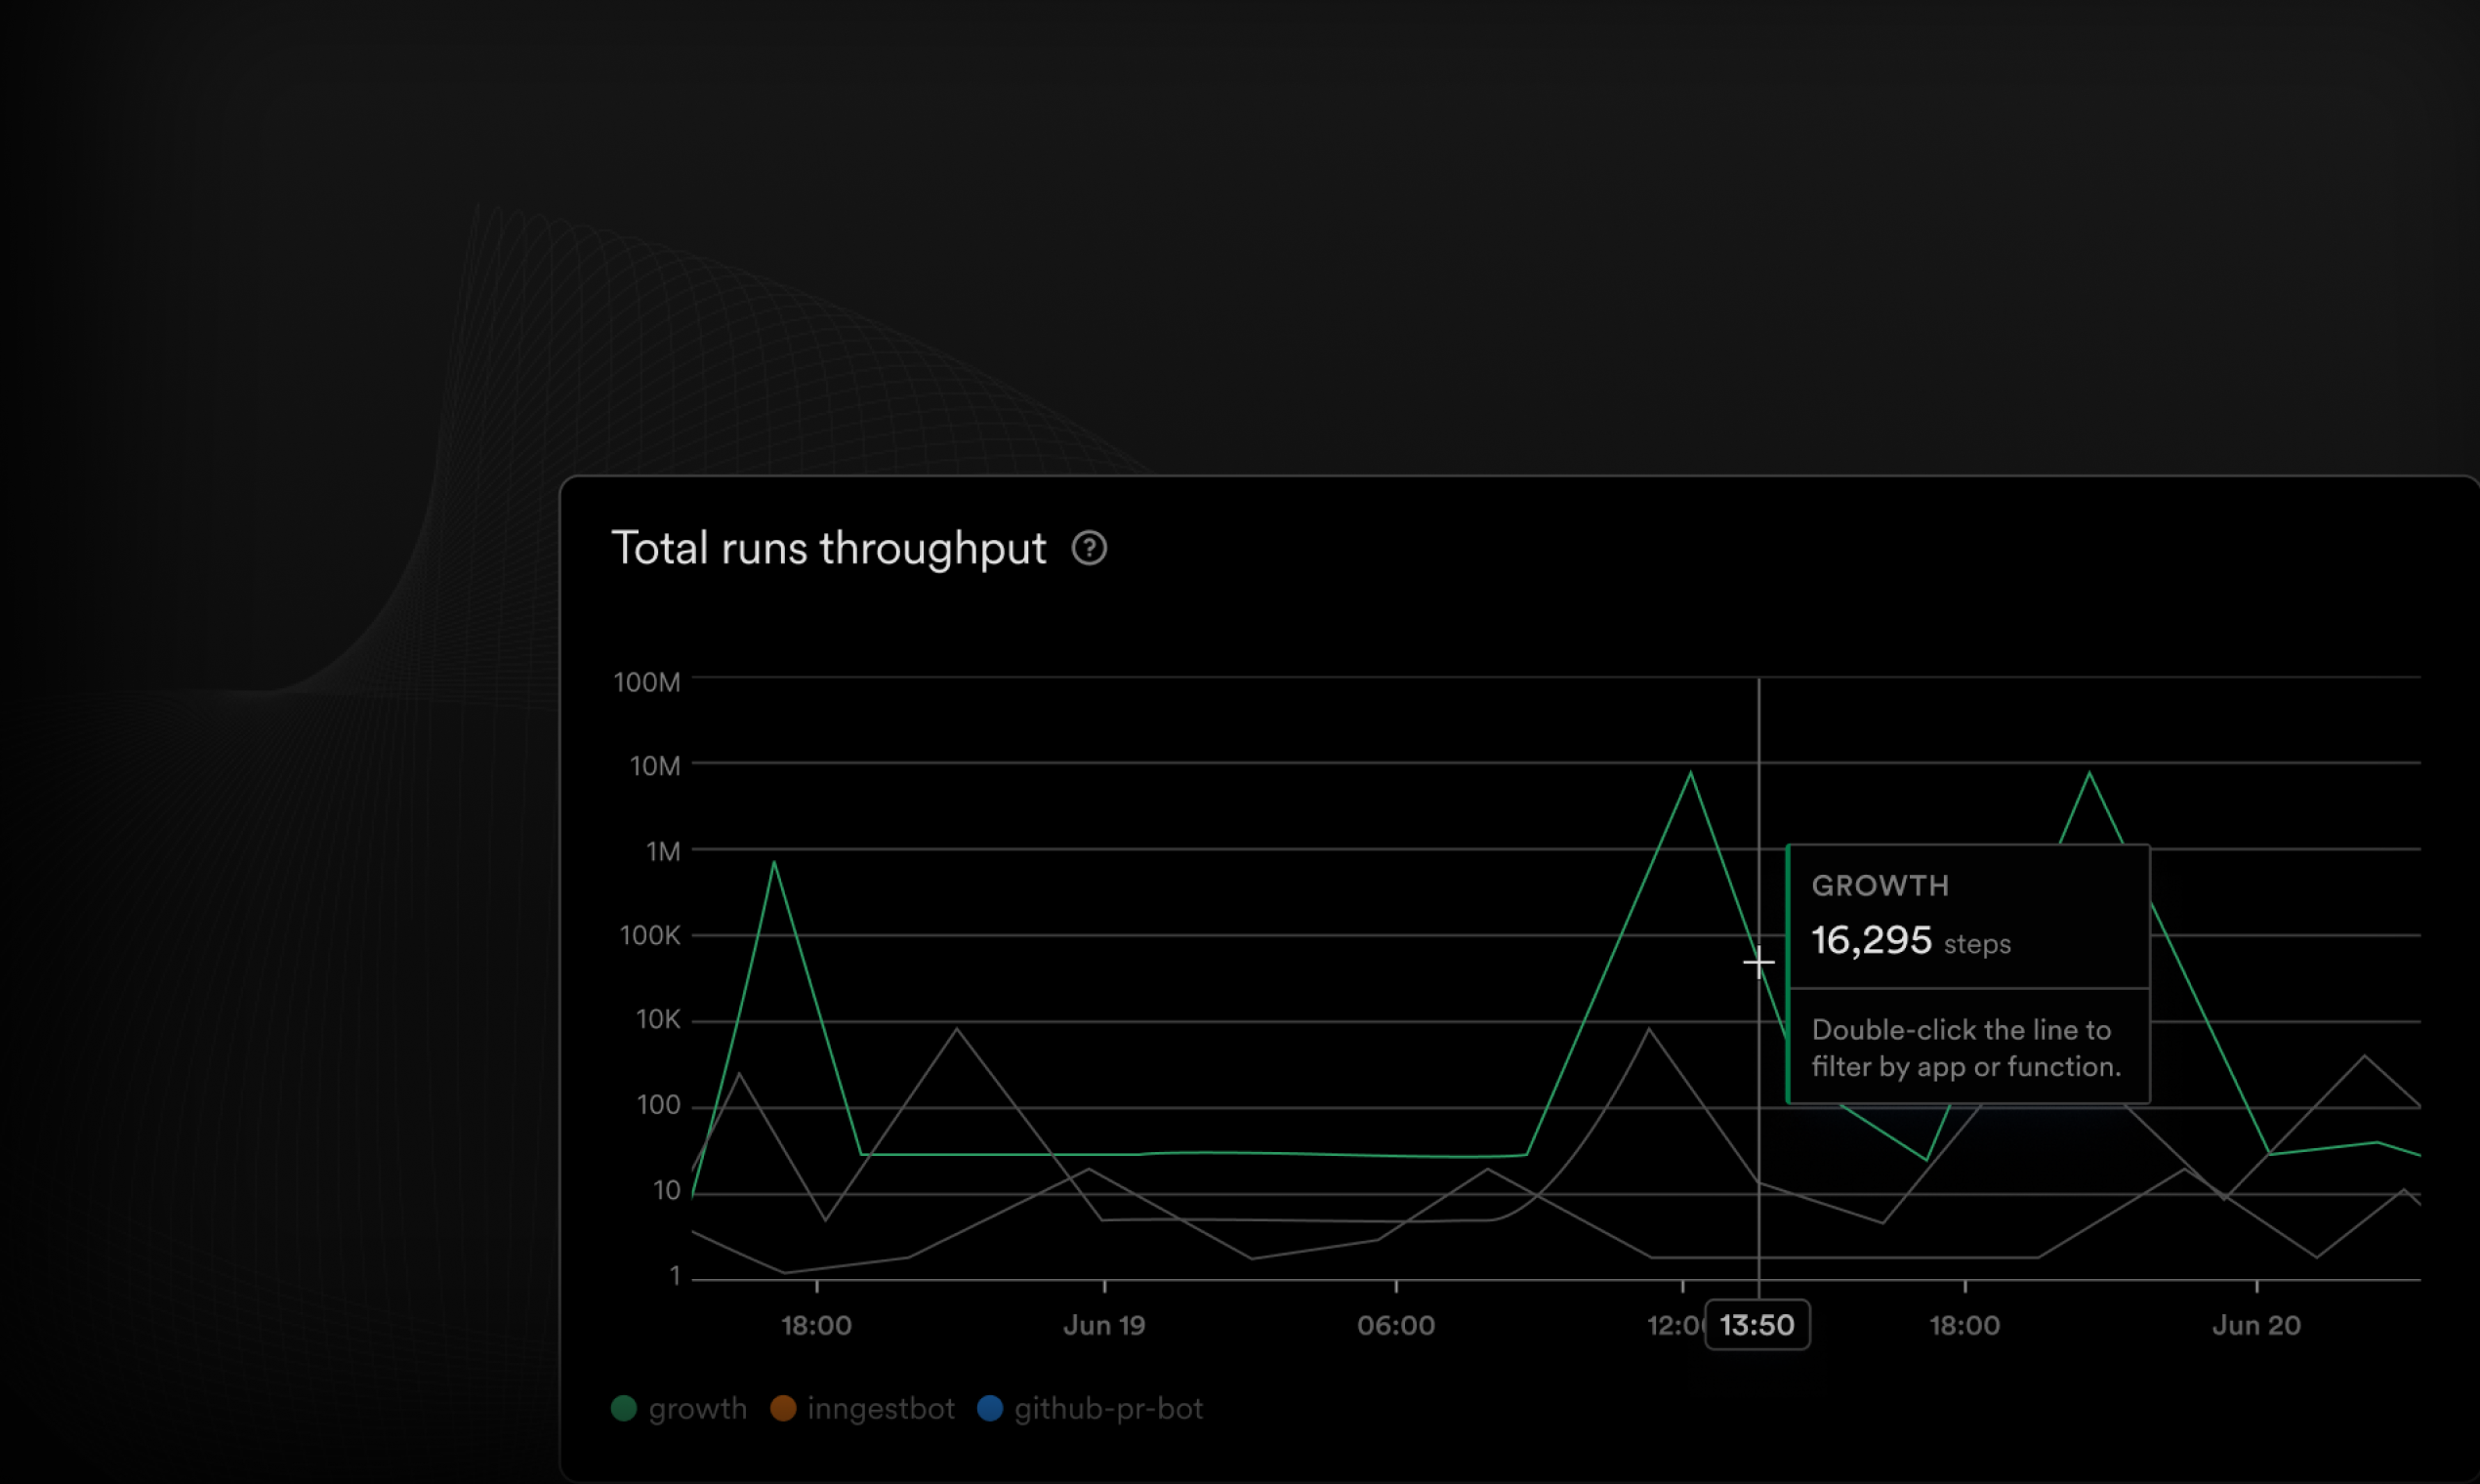
System health at a glance: View the health of your applications at the environment level, helping you spot issues before they escalate. With metrics like backlog, concurrency, failure rates, and usage analytics, you can monitor your system holistically without having to dig into each function individually.
-
Top-down debugging: If an issue arises, you can quickly drill down from the system-wide view into specific functions or steps that are causing problems. This eliminates the need for manual investigation through logs and metrics, enabling faster troubleshooting.
-
Clear visualizations: The new dashboards are intuitive and focused on key performance indicators. These visualizations allow you to track critical data points, ensuring you always have the most relevant insights at hand.
These enhancements don't aim to replace dedicated monitoring platforms like Datadog. Instead, they provide exactly what you need to manage your Inngest applications with confidence, offering the most important data for your Inngest-powered applications without unnecessary complexity.
What's new
Since this blog was published, we've added several powerful observability features:
Query your data with Insights (September 2025)
Inngest now includes Insights—the ability to query your events and runs using SQL directly in the dashboard:
```sql SELECT event_name, COUNT(*) as event_count FROM events WHERE created_at > NOW() - INTERVAL '7 days' GROUP BY event_name ORDER BY event_count DESC; ```
Insights enables:
- Custom queries for event analysis
- Run performance tracking
- Data export for custom reporting
- Schema explorer to discover available data
Particularly powerful for AI workflows—track token usage, model calls, and agent performance directly from your workflow data.
Read the announcement | View changelog
Export metrics to Datadog (June 2025)
For teams using Datadog, you can now export all Inngest metrics for centralized monitoring and alerting. Configure the integration in your Inngest dashboard under Settings > Integrations > Datadog.
Available metrics include:
inngest_function_run_scheduled_totalinngest_function_run_started_totalinngest_function_run_ended_total- And more
AI-assisted local development with MCP (October 2025)
The Inngest dev server now supports MCP (Model Context Protocol), allowing you to connect Claude Code, Cursor, and other AI assistants directly to your local Inngest functions:
{
  "mcpServers": {
    "inngest-dev": {
      "command": "curl",
      "args": [
        "-X", "POST",
        "http://127.0.0.1:8288/mcp",
        "-H", "Content-Type: application/json",
        "-d", "@-"
      ]
    }
  }
}
AI assistants can now:
- Send test events and monitor executions
- Debug failed runs with full trace access
- Test entire workflows end-to-end automatically
- Search Inngest documentation offline
Learn more about the MCP integration | View changelog
The future of Inngest observability
By combining the new trace experience with a monitoring dashboard, we're equipping you with powerful tools to manage, monitor, and troubleshoot your durable functions with effortless control. The ability to see both detailed execution traces and a holistic view of system health means you can move seamlessly between resolving function-level issues and addressing broader system-wide concerns.
These updates reflect our commitment to improving observability and giving developers the tools they need to build resilient, durable workflows. As we continue to expand Inngest's capabilities, we'd love to hear your feedback to make sure we're meeting the needs of your team.
Start using these new features today and experience a new level of visibility and control over your applications. Whether you're troubleshooting a specific function or monitoring your entire system, these enhancements are designed to make your job easier and more efficient.
Stay tuned for future updates, including potential data export capabilities and even more advanced insights tailored to your durable workflows.